Comanche vs Native/Alaskan 9th Grade
COMPARE
Comanche
Native/Alaskan
9th Grade
9th Grade Comparison
Comanche
Natives/Alaskans
94.6%
9TH GRADE
14.9/ 100
METRIC RATING
209th/ 347
METRIC RANK
93.9%
9TH GRADE
0.4/ 100
METRIC RATING
265th/ 347
METRIC RANK
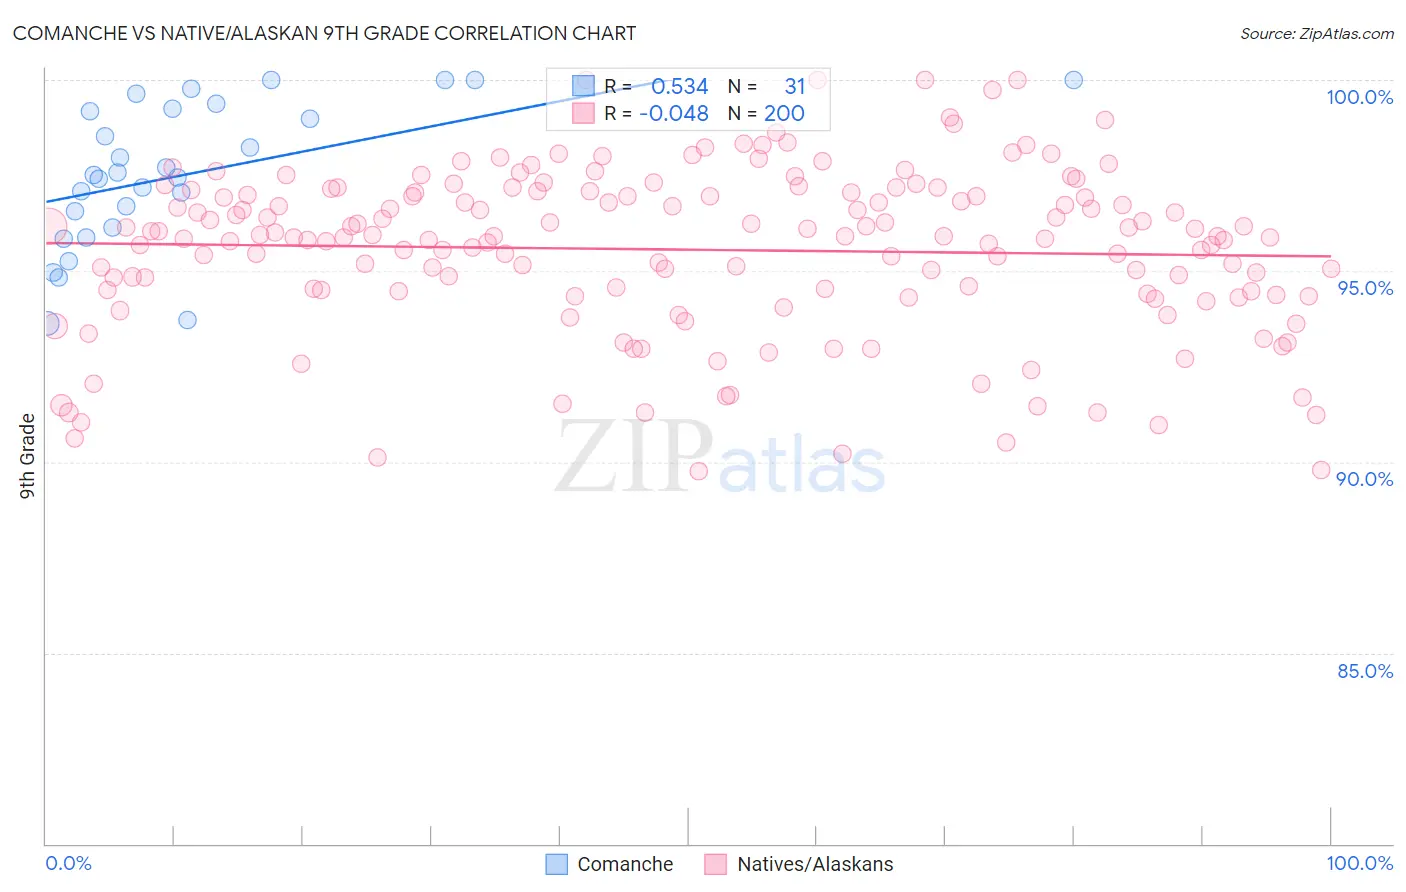
Comanche vs Native/Alaskan 9th Grade Correlation Chart
The statistical analysis conducted on geographies consisting of 109,786,530 people shows a substantial positive correlation between the proportion of Comanche and percentage of population with at least 9th grade education in the United States with a correlation coefficient (R) of 0.534 and weighted average of 94.6%. Similarly, the statistical analysis conducted on geographies consisting of 513,075,822 people shows no correlation between the proportion of Natives/Alaskans and percentage of population with at least 9th grade education in the United States with a correlation coefficient (R) of -0.048 and weighted average of 93.9%, a difference of 0.72%.
9th Grade Correlation Summary
| Measurement | Comanche | Native/Alaskan |
| Minimum | 93.6% | 89.8% |
| Maximum | 100.0% | 100.0% |
| Range | 6.4% | 10.2% |
| Mean | 97.5% | 95.6% |
| Median | 97.5% | 95.9% |
| Interquartile 25% (IQ1) | 96.1% | 94.4% |
| Interquartile 75% (IQ3) | 99.2% | 97.1% |
| Interquartile Range (IQR) | 3.1% | 2.6% |
| Standard Deviation (Sample) | 1.9% | 2.2% |
| Standard Deviation (Population) | 1.8% | 2.2% |
Similar Demographics by 9th Grade
Demographics Similar to Comanche by 9th Grade
In terms of 9th grade, the demographic groups most similar to Comanche are Immigrants from Pakistan (94.6%, a difference of 0.010%), Immigrants from Morocco (94.6%, a difference of 0.020%), Immigrants from Chile (94.5%, a difference of 0.020%), Samoan (94.6%, a difference of 0.030%), and Immigrants from Sudan (94.6%, a difference of 0.040%).
| Demographics | Rating | Rank | 9th Grade |
| Immigrants | Eastern Asia | 19.8 /100 | #202 | Poor 94.6% |
| Immigrants | Bahamas | 19.8 /100 | #203 | Poor 94.6% |
| Moroccans | 19.6 /100 | #204 | Poor 94.6% |
| Immigrants | Sudan | 17.6 /100 | #205 | Poor 94.6% |
| Samoans | 17.3 /100 | #206 | Poor 94.6% |
| Immigrants | Morocco | 16.3 /100 | #207 | Poor 94.6% |
| Immigrants | Pakistan | 15.5 /100 | #208 | Poor 94.6% |
| Comanche | 14.9 /100 | #209 | Poor 94.6% |
| Immigrants | Chile | 13.4 /100 | #210 | Poor 94.5% |
| Immigrants | Indonesia | 12.3 /100 | #211 | Poor 94.5% |
| Immigrants | Malaysia | 12.2 /100 | #212 | Poor 94.5% |
| Immigrants | Oceania | 12.1 /100 | #213 | Poor 94.5% |
| Immigrants | Liberia | 11.8 /100 | #214 | Poor 94.5% |
| Immigrants | Syria | 11.0 /100 | #215 | Poor 94.5% |
| Immigrants | Western Asia | 10.7 /100 | #216 | Poor 94.5% |
Demographics Similar to Natives/Alaskans by 9th Grade
In terms of 9th grade, the demographic groups most similar to Natives/Alaskans are Immigrants from Congo (93.9%, a difference of 0.0%), Immigrants from Jamaica (93.9%, a difference of 0.010%), Immigrants from Uzbekistan (93.9%, a difference of 0.010%), Navajo (93.9%, a difference of 0.010%), and South American (93.9%, a difference of 0.030%).
| Demographics | Rating | Rank | 9th Grade |
| Immigrants | Thailand | 0.5 /100 | #258 | Tragic 93.9% |
| Ghanaians | 0.5 /100 | #259 | Tragic 93.9% |
| Pima | 0.4 /100 | #260 | Tragic 93.9% |
| South Americans | 0.4 /100 | #261 | Tragic 93.9% |
| Immigrants | Jamaica | 0.4 /100 | #262 | Tragic 93.9% |
| Immigrants | Uzbekistan | 0.4 /100 | #263 | Tragic 93.9% |
| Immigrants | Congo | 0.4 /100 | #264 | Tragic 93.9% |
| Natives/Alaskans | 0.4 /100 | #265 | Tragic 93.9% |
| Navajo | 0.3 /100 | #266 | Tragic 93.9% |
| Armenians | 0.3 /100 | #267 | Tragic 93.9% |
| Immigrants | Bolivia | 0.3 /100 | #268 | Tragic 93.9% |
| Immigrants | Uruguay | 0.2 /100 | #269 | Tragic 93.8% |
| Yuman | 0.2 /100 | #270 | Tragic 93.8% |
| Immigrants | Ghana | 0.2 /100 | #271 | Tragic 93.8% |
| Immigrants | Western Africa | 0.2 /100 | #272 | Tragic 93.8% |