Comanche vs Immigrants from Grenada In Labor Force | Age 30-34
COMPARE
Comanche
Immigrants from Grenada
In Labor Force | Age 30-34
In Labor Force | Age 30-34 Comparison
Comanche
Immigrants from Grenada
82.6%
IN LABOR FORCE | AGE 30-34
0.0/ 100
METRIC RATING
297th/ 347
METRIC RANK
83.5%
IN LABOR FORCE | AGE 30-34
0.0/ 100
METRIC RATING
275th/ 347
METRIC RANK
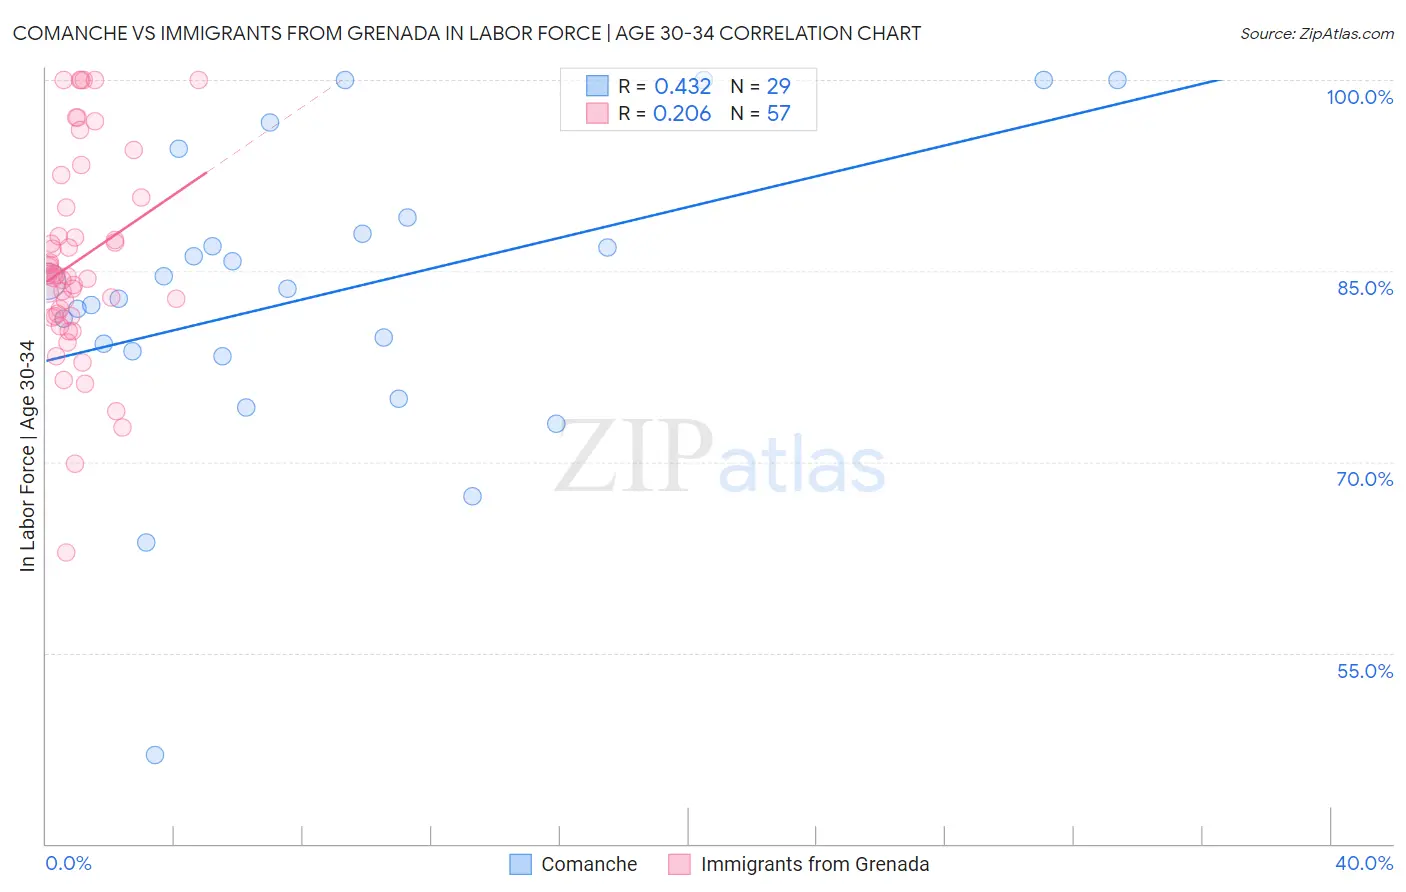
Comanche vs Immigrants from Grenada In Labor Force | Age 30-34 Correlation Chart
The statistical analysis conducted on geographies consisting of 109,766,840 people shows a moderate positive correlation between the proportion of Comanche and labor force participation rate among population between the ages 30 and 34 in the United States with a correlation coefficient (R) of 0.432 and weighted average of 82.6%. Similarly, the statistical analysis conducted on geographies consisting of 67,171,211 people shows a weak positive correlation between the proportion of Immigrants from Grenada and labor force participation rate among population between the ages 30 and 34 in the United States with a correlation coefficient (R) of 0.206 and weighted average of 83.5%, a difference of 1.1%.
In Labor Force | Age 30-34 Correlation Summary
| Measurement | Comanche | Immigrants from Grenada |
| Minimum | 46.9% | 62.9% |
| Maximum | 100.0% | 100.0% |
| Range | 53.1% | 37.1% |
| Mean | 83.1% | 85.8% |
| Median | 83.6% | 84.7% |
| Interquartile 25% (IQ1) | 78.5% | 81.4% |
| Interquartile 75% (IQ3) | 88.5% | 90.4% |
| Interquartile Range (IQR) | 10.0% | 9.0% |
| Standard Deviation (Sample) | 11.7% | 8.0% |
| Standard Deviation (Population) | 11.5% | 7.9% |
Similar Demographics by In Labor Force | Age 30-34
Demographics Similar to Comanche by In Labor Force | Age 30-34
In terms of in labor force | age 30-34, the demographic groups most similar to Comanche are Aleut (82.6%, a difference of 0.0%), Chippewa (82.6%, a difference of 0.010%), Pennsylvania German (82.6%, a difference of 0.030%), Immigrants from Central America (82.5%, a difference of 0.13%), and American (82.7%, a difference of 0.15%).
| Demographics | Rating | Rank | In Labor Force | Age 30-34 |
| Blackfeet | 0.0 /100 | #290 | Tragic 82.8% |
| Potawatomi | 0.0 /100 | #291 | Tragic 82.8% |
| Blacks/African Americans | 0.0 /100 | #292 | Tragic 82.8% |
| Nepalese | 0.0 /100 | #293 | Tragic 82.7% |
| Americans | 0.0 /100 | #294 | Tragic 82.7% |
| Pennsylvania Germans | 0.0 /100 | #295 | Tragic 82.6% |
| Chippewa | 0.0 /100 | #296 | Tragic 82.6% |
| Comanche | 0.0 /100 | #297 | Tragic 82.6% |
| Aleuts | 0.0 /100 | #298 | Tragic 82.6% |
| Immigrants | Central America | 0.0 /100 | #299 | Tragic 82.5% |
| Hmong | 0.0 /100 | #300 | Tragic 82.4% |
| Hispanics or Latinos | 0.0 /100 | #301 | Tragic 82.4% |
| Ottawa | 0.0 /100 | #302 | Tragic 82.4% |
| Immigrants | Micronesia | 0.0 /100 | #303 | Tragic 82.4% |
| Tlingit-Haida | 0.0 /100 | #304 | Tragic 82.3% |
Demographics Similar to Immigrants from Grenada by In Labor Force | Age 30-34
In terms of in labor force | age 30-34, the demographic groups most similar to Immigrants from Grenada are Belizean (83.5%, a difference of 0.010%), Tongan (83.5%, a difference of 0.010%), Guamanian/Chamorro (83.5%, a difference of 0.020%), Delaware (83.5%, a difference of 0.030%), and Spanish (83.5%, a difference of 0.070%).
| Demographics | Rating | Rank | In Labor Force | Age 30-34 |
| Immigrants | Bangladesh | 0.1 /100 | #268 | Tragic 83.6% |
| Vietnamese | 0.1 /100 | #269 | Tragic 83.6% |
| Spanish Americans | 0.0 /100 | #270 | Tragic 83.5% |
| Spanish | 0.0 /100 | #271 | Tragic 83.5% |
| Immigrants | Nonimmigrants | 0.0 /100 | #272 | Tragic 83.5% |
| Guamanians/Chamorros | 0.0 /100 | #273 | Tragic 83.5% |
| Belizeans | 0.0 /100 | #274 | Tragic 83.5% |
| Immigrants | Grenada | 0.0 /100 | #275 | Tragic 83.5% |
| Tongans | 0.0 /100 | #276 | Tragic 83.5% |
| Delaware | 0.0 /100 | #277 | Tragic 83.5% |
| Fijians | 0.0 /100 | #278 | Tragic 83.4% |
| Immigrants | Fiji | 0.0 /100 | #279 | Tragic 83.4% |
| Africans | 0.0 /100 | #280 | Tragic 83.4% |
| Samoans | 0.0 /100 | #281 | Tragic 83.3% |
| Mexican American Indians | 0.0 /100 | #282 | Tragic 83.2% |