Comanche vs Immigrants from Eastern Africa In Labor Force | Age 30-34
COMPARE
Comanche
Immigrants from Eastern Africa
In Labor Force | Age 30-34
In Labor Force | Age 30-34 Comparison
Comanche
Immigrants from Eastern Africa
82.6%
IN LABOR FORCE | AGE 30-34
0.0/ 100
METRIC RATING
297th/ 347
METRIC RANK
85.9%
IN LABOR FORCE | AGE 30-34
100.0/ 100
METRIC RATING
26th/ 347
METRIC RANK
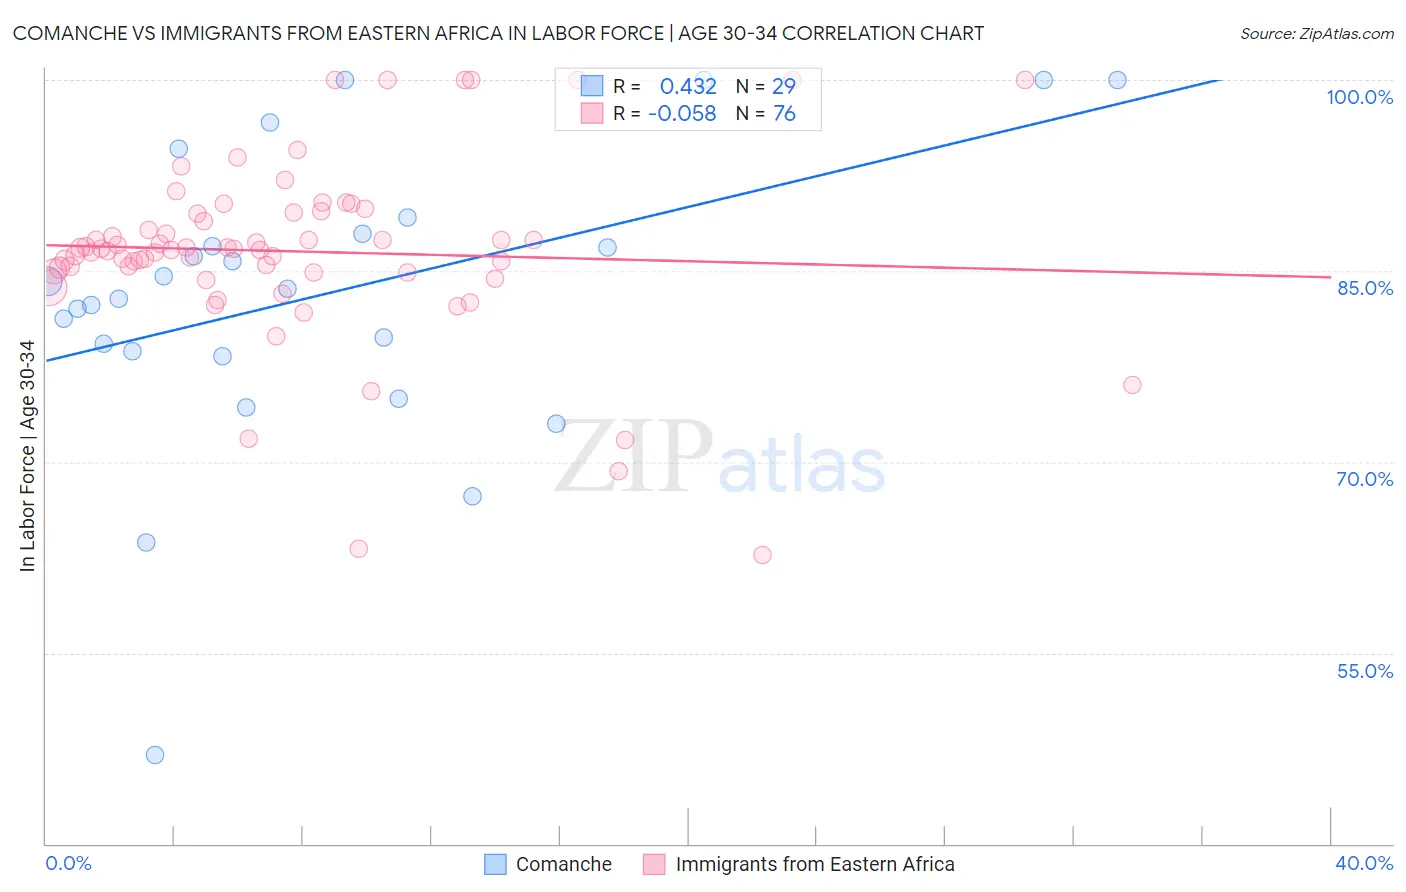
Comanche vs Immigrants from Eastern Africa In Labor Force | Age 30-34 Correlation Chart
The statistical analysis conducted on geographies consisting of 109,766,840 people shows a moderate positive correlation between the proportion of Comanche and labor force participation rate among population between the ages 30 and 34 in the United States with a correlation coefficient (R) of 0.432 and weighted average of 82.6%. Similarly, the statistical analysis conducted on geographies consisting of 354,960,514 people shows a slight negative correlation between the proportion of Immigrants from Eastern Africa and labor force participation rate among population between the ages 30 and 34 in the United States with a correlation coefficient (R) of -0.058 and weighted average of 85.9%, a difference of 4.1%.
In Labor Force | Age 30-34 Correlation Summary
| Measurement | Comanche | Immigrants from Eastern Africa |
| Minimum | 46.9% | 62.7% |
| Maximum | 100.0% | 100.0% |
| Range | 53.1% | 37.3% |
| Mean | 83.1% | 86.5% |
| Median | 83.6% | 86.7% |
| Interquartile 25% (IQ1) | 78.5% | 84.9% |
| Interquartile 75% (IQ3) | 88.5% | 89.6% |
| Interquartile Range (IQR) | 10.0% | 4.6% |
| Standard Deviation (Sample) | 11.7% | 7.2% |
| Standard Deviation (Population) | 11.5% | 7.1% |
Similar Demographics by In Labor Force | Age 30-34
Demographics Similar to Comanche by In Labor Force | Age 30-34
In terms of in labor force | age 30-34, the demographic groups most similar to Comanche are Aleut (82.6%, a difference of 0.0%), Chippewa (82.6%, a difference of 0.010%), Pennsylvania German (82.6%, a difference of 0.030%), Immigrants from Central America (82.5%, a difference of 0.13%), and American (82.7%, a difference of 0.15%).
| Demographics | Rating | Rank | In Labor Force | Age 30-34 |
| Blackfeet | 0.0 /100 | #290 | Tragic 82.8% |
| Potawatomi | 0.0 /100 | #291 | Tragic 82.8% |
| Blacks/African Americans | 0.0 /100 | #292 | Tragic 82.8% |
| Nepalese | 0.0 /100 | #293 | Tragic 82.7% |
| Americans | 0.0 /100 | #294 | Tragic 82.7% |
| Pennsylvania Germans | 0.0 /100 | #295 | Tragic 82.6% |
| Chippewa | 0.0 /100 | #296 | Tragic 82.6% |
| Comanche | 0.0 /100 | #297 | Tragic 82.6% |
| Aleuts | 0.0 /100 | #298 | Tragic 82.6% |
| Immigrants | Central America | 0.0 /100 | #299 | Tragic 82.5% |
| Hmong | 0.0 /100 | #300 | Tragic 82.4% |
| Hispanics or Latinos | 0.0 /100 | #301 | Tragic 82.4% |
| Ottawa | 0.0 /100 | #302 | Tragic 82.4% |
| Immigrants | Micronesia | 0.0 /100 | #303 | Tragic 82.4% |
| Tlingit-Haida | 0.0 /100 | #304 | Tragic 82.3% |
Demographics Similar to Immigrants from Eastern Africa by In Labor Force | Age 30-34
In terms of in labor force | age 30-34, the demographic groups most similar to Immigrants from Eastern Africa are Immigrants from North Macedonia (85.9%, a difference of 0.010%), Immigrants from Eritrea (85.9%, a difference of 0.020%), Immigrants from Liberia (85.9%, a difference of 0.020%), Bermudan (85.9%, a difference of 0.030%), and Estonian (85.9%, a difference of 0.030%).
| Demographics | Rating | Rank | In Labor Force | Age 30-34 |
| Sierra Leoneans | 100.0 /100 | #19 | Exceptional 86.0% |
| Bulgarians | 100.0 /100 | #20 | Exceptional 86.0% |
| Immigrants | Bulgaria | 100.0 /100 | #21 | Exceptional 86.0% |
| Bermudans | 100.0 /100 | #22 | Exceptional 85.9% |
| Estonians | 100.0 /100 | #23 | Exceptional 85.9% |
| Immigrants | Eritrea | 100.0 /100 | #24 | Exceptional 85.9% |
| Immigrants | North Macedonia | 100.0 /100 | #25 | Exceptional 85.9% |
| Immigrants | Eastern Africa | 100.0 /100 | #26 | Exceptional 85.9% |
| Immigrants | Liberia | 100.0 /100 | #27 | Exceptional 85.9% |
| Immigrants | Latvia | 100.0 /100 | #28 | Exceptional 85.9% |
| Tsimshian | 100.0 /100 | #29 | Exceptional 85.8% |
| Immigrants | Hong Kong | 100.0 /100 | #30 | Exceptional 85.8% |
| Paraguayans | 99.9 /100 | #31 | Exceptional 85.8% |
| Cypriots | 99.9 /100 | #32 | Exceptional 85.8% |
| Immigrants | Bosnia and Herzegovina | 99.9 /100 | #33 | Exceptional 85.8% |