Immigrants from China vs Arapaho In Labor Force | Age 25-29
COMPARE
Immigrants from China
Arapaho
In Labor Force | Age 25-29
In Labor Force | Age 25-29 Comparison
Immigrants from China
Arapaho
84.6%
IN LABOR FORCE | AGE 25-29
45.7/ 100
METRIC RATING
177th/ 347
METRIC RANK
76.6%
IN LABOR FORCE | AGE 25-29
0.0/ 100
METRIC RATING
343rd/ 347
METRIC RANK
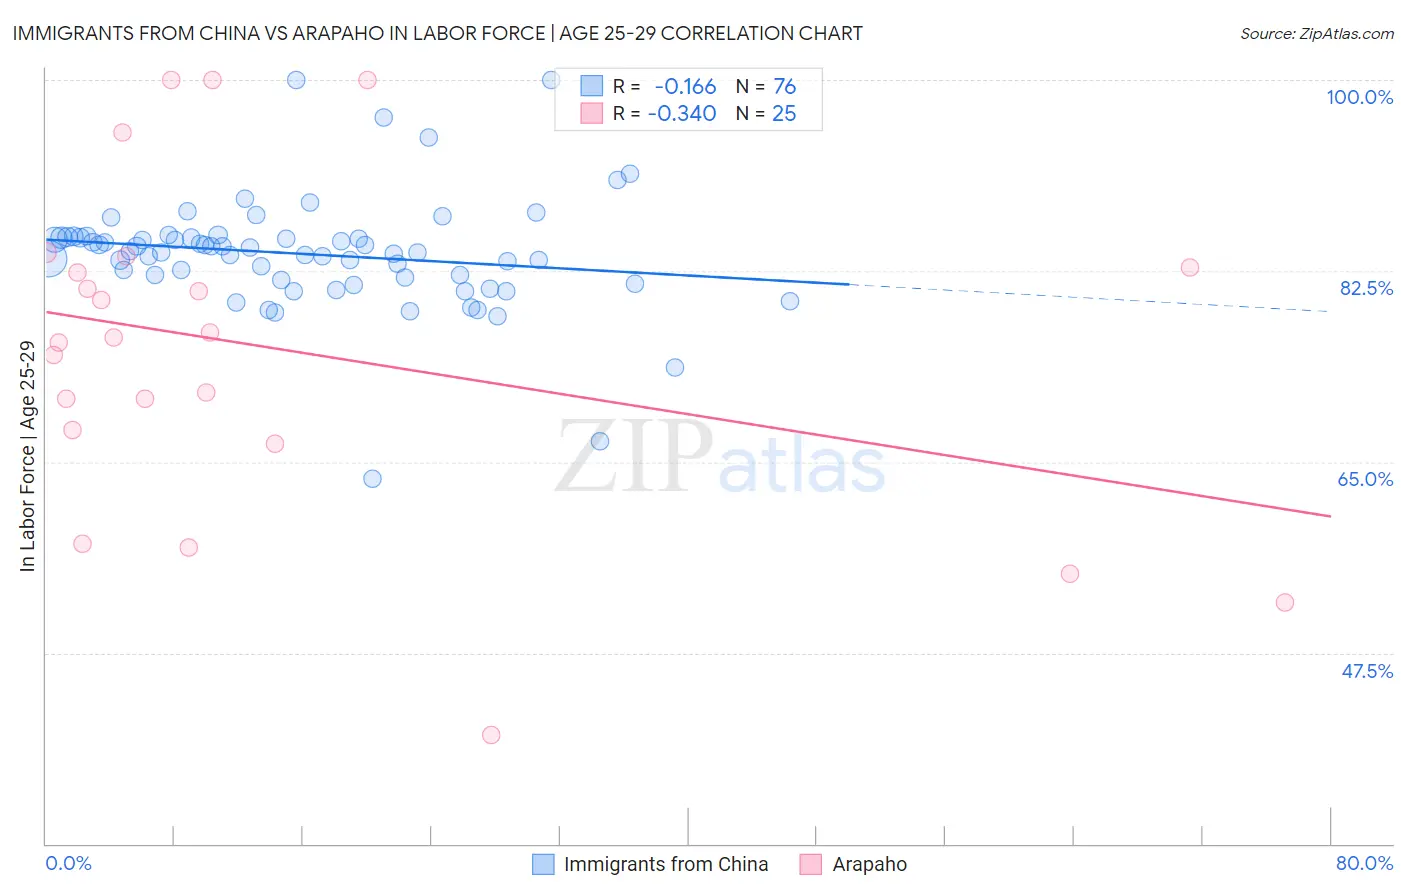
Immigrants from China vs Arapaho In Labor Force | Age 25-29 Correlation Chart
The statistical analysis conducted on geographies consisting of 456,821,208 people shows a poor negative correlation between the proportion of Immigrants from China and labor force participation rate among population between the ages 25 and 29 in the United States with a correlation coefficient (R) of -0.166 and weighted average of 84.6%. Similarly, the statistical analysis conducted on geographies consisting of 29,773,851 people shows a mild negative correlation between the proportion of Arapaho and labor force participation rate among population between the ages 25 and 29 in the United States with a correlation coefficient (R) of -0.340 and weighted average of 76.6%, a difference of 10.5%.
In Labor Force | Age 25-29 Correlation Summary
| Measurement | Immigrants from China | Arapaho |
| Minimum | 63.5% | 40.0% |
| Maximum | 100.0% | 100.0% |
| Range | 36.5% | 60.0% |
| Mean | 84.0% | 75.3% |
| Median | 84.3% | 76.4% |
| Interquartile 25% (IQ1) | 81.8% | 67.3% |
| Interquartile 75% (IQ3) | 85.6% | 83.3% |
| Interquartile Range (IQR) | 3.7% | 16.0% |
| Standard Deviation (Sample) | 5.4% | 15.3% |
| Standard Deviation (Population) | 5.3% | 15.0% |
Similar Demographics by In Labor Force | Age 25-29
Demographics Similar to Immigrants from China by In Labor Force | Age 25-29
In terms of in labor force | age 25-29, the demographic groups most similar to Immigrants from China are Immigrants from Thailand (84.6%, a difference of 0.0%), Malaysian (84.6%, a difference of 0.010%), Immigrants from Argentina (84.6%, a difference of 0.010%), Hungarian (84.6%, a difference of 0.020%), and Immigrants from South America (84.6%, a difference of 0.020%).
| Demographics | Rating | Rank | In Labor Force | Age 25-29 |
| Tongans | 52.4 /100 | #170 | Average 84.7% |
| Immigrants | Vietnam | 50.5 /100 | #171 | Average 84.7% |
| Immigrants | Western Europe | 50.4 /100 | #172 | Average 84.7% |
| Assyrians/Chaldeans/Syriacs | 50.2 /100 | #173 | Average 84.7% |
| Palestinians | 50.0 /100 | #174 | Average 84.7% |
| Hungarians | 47.8 /100 | #175 | Average 84.6% |
| Malaysians | 46.8 /100 | #176 | Average 84.6% |
| Immigrants | China | 45.7 /100 | #177 | Average 84.6% |
| Immigrants | Thailand | 45.2 /100 | #178 | Average 84.6% |
| Immigrants | Argentina | 44.0 /100 | #179 | Average 84.6% |
| Immigrants | South America | 42.9 /100 | #180 | Average 84.6% |
| Immigrants | Norway | 41.9 /100 | #181 | Average 84.6% |
| Europeans | 40.3 /100 | #182 | Average 84.6% |
| Scottish | 40.1 /100 | #183 | Average 84.6% |
| Immigrants | Kuwait | 38.2 /100 | #184 | Fair 84.6% |
Demographics Similar to Arapaho by In Labor Force | Age 25-29
In terms of in labor force | age 25-29, the demographic groups most similar to Arapaho are Hopi (76.5%, a difference of 0.060%), Pueblo (77.5%, a difference of 1.2%), Tohono O'odham (77.5%, a difference of 1.2%), Paiute (78.1%, a difference of 2.0%), and Immigrants from Yemen (78.2%, a difference of 2.2%).
| Demographics | Rating | Rank | In Labor Force | Age 25-29 |
| Sioux | 0.0 /100 | #333 | Tragic 79.7% |
| Yuman | 0.0 /100 | #334 | Tragic 79.3% |
| Natives/Alaskans | 0.0 /100 | #335 | Tragic 79.3% |
| Apache | 0.0 /100 | #336 | Tragic 79.2% |
| Crow | 0.0 /100 | #337 | Tragic 78.6% |
| Lumbee | 0.0 /100 | #338 | Tragic 78.3% |
| Immigrants | Yemen | 0.0 /100 | #339 | Tragic 78.2% |
| Paiute | 0.0 /100 | #340 | Tragic 78.1% |
| Tohono O'odham | 0.0 /100 | #341 | Tragic 77.5% |
| Pueblo | 0.0 /100 | #342 | Tragic 77.5% |
| Arapaho | 0.0 /100 | #343 | Tragic 76.6% |
| Hopi | 0.0 /100 | #344 | Tragic 76.5% |
| Navajo | 0.0 /100 | #345 | Tragic 74.6% |
| Pima | 0.0 /100 | #346 | Tragic 74.3% |
| Yup'ik | 0.0 /100 | #347 | Tragic 73.1% |