Comanche vs Arapaho Female Unemployment
COMPARE
Comanche
Arapaho
Female Unemployment
Female Unemployment Comparison
Comanche
Arapaho
5.4%
FEMALE UNEMPLOYMENT
10.0/ 100
METRIC RATING
216th/ 347
METRIC RANK
8.8%
FEMALE UNEMPLOYMENT
0.0/ 100
METRIC RATING
343rd/ 347
METRIC RANK
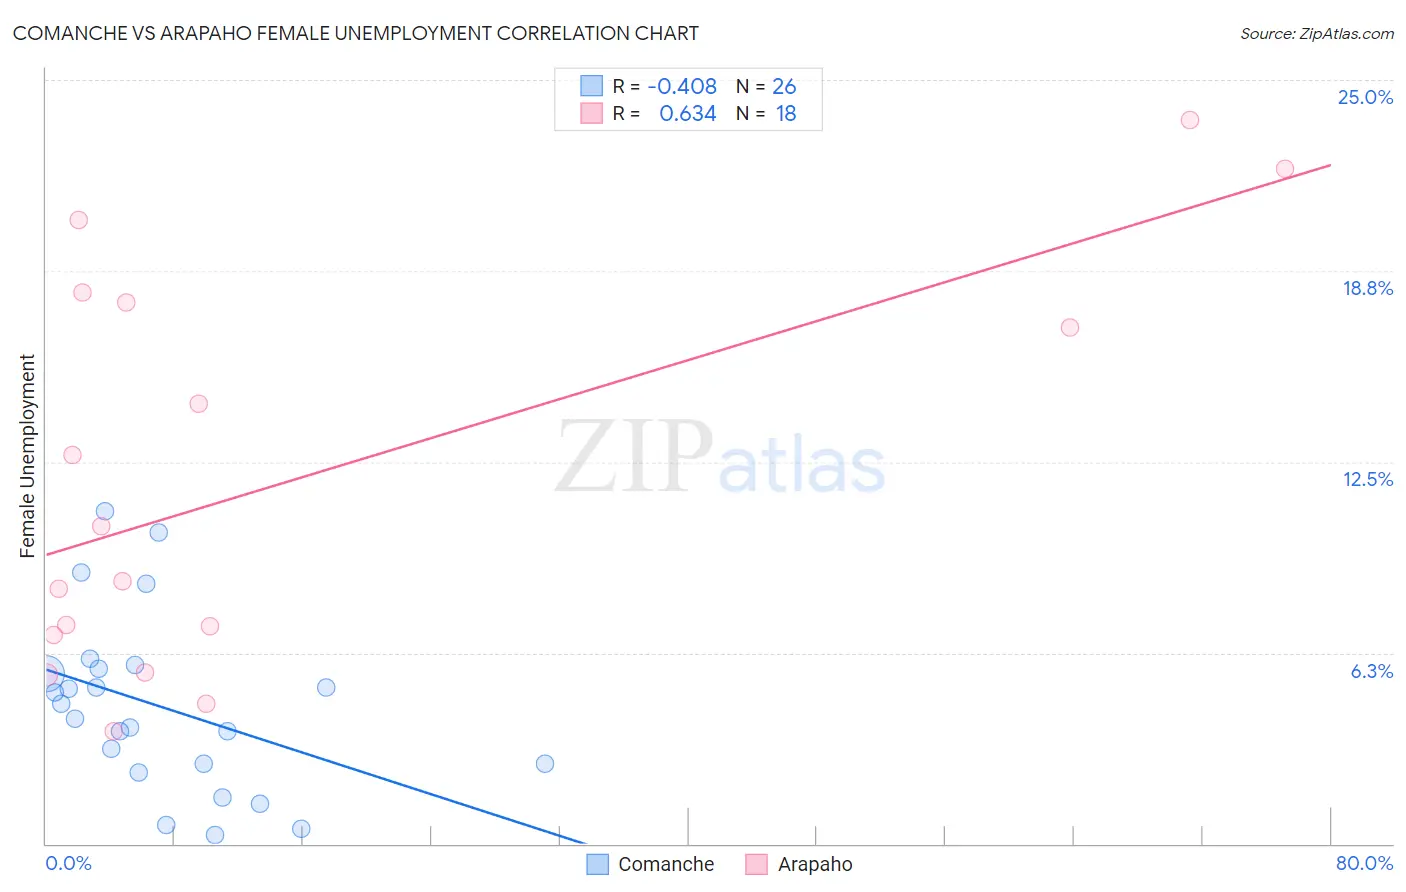
Comanche vs Arapaho Female Unemployment Correlation Chart
The statistical analysis conducted on geographies consisting of 109,454,085 people shows a moderate negative correlation between the proportion of Comanche and unemploymnet rate among females in the United States with a correlation coefficient (R) of -0.408 and weighted average of 5.4%. Similarly, the statistical analysis conducted on geographies consisting of 29,729,190 people shows a significant positive correlation between the proportion of Arapaho and unemploymnet rate among females in the United States with a correlation coefficient (R) of 0.634 and weighted average of 8.8%, a difference of 61.8%.
Female Unemployment Correlation Summary
| Measurement | Comanche | Arapaho |
| Minimum | 0.30% | 3.7% |
| Maximum | 10.9% | 23.7% |
| Range | 10.6% | 20.0% |
| Mean | 4.5% | 11.9% |
| Median | 4.3% | 9.5% |
| Interquartile 25% (IQ1) | 2.6% | 6.9% |
| Interquartile 75% (IQ3) | 5.7% | 17.7% |
| Interquartile Range (IQR) | 3.1% | 10.9% |
| Standard Deviation (Sample) | 2.8% | 6.5% |
| Standard Deviation (Population) | 2.8% | 6.3% |
Similar Demographics by Female Unemployment
Demographics Similar to Comanche by Female Unemployment
In terms of female unemployment, the demographic groups most similar to Comanche are Immigrants from Nicaragua (5.4%, a difference of 0.020%), Seminole (5.4%, a difference of 0.040%), Peruvian (5.4%, a difference of 0.070%), Samoan (5.4%, a difference of 0.090%), and Bermudan (5.4%, a difference of 0.17%).
| Demographics | Rating | Rank | Female Unemployment |
| Koreans | 13.4 /100 | #209 | Poor 5.4% |
| Choctaw | 12.3 /100 | #210 | Poor 5.4% |
| Ottawa | 11.6 /100 | #211 | Poor 5.4% |
| Uruguayans | 11.4 /100 | #212 | Poor 5.4% |
| Samoans | 10.6 /100 | #213 | Poor 5.4% |
| Seminole | 10.3 /100 | #214 | Poor 5.4% |
| Immigrants | Nicaragua | 10.2 /100 | #215 | Poor 5.4% |
| Comanche | 10.0 /100 | #216 | Poor 5.4% |
| Peruvians | 9.6 /100 | #217 | Tragic 5.4% |
| Bermudans | 9.0 /100 | #218 | Tragic 5.4% |
| South Americans | 8.6 /100 | #219 | Tragic 5.4% |
| Immigrants | Africa | 8.5 /100 | #220 | Tragic 5.4% |
| Brazilians | 7.3 /100 | #221 | Tragic 5.5% |
| Nicaraguans | 7.2 /100 | #222 | Tragic 5.5% |
| Delaware | 7.2 /100 | #223 | Tragic 5.5% |
Demographics Similar to Arapaho by Female Unemployment
In terms of female unemployment, the demographic groups most similar to Arapaho are Puerto Rican (8.3%, a difference of 5.4%), Pima (9.3%, a difference of 6.2%), Inupiat (8.2%, a difference of 7.7%), Hopi (8.1%, a difference of 8.6%), and Yuman (9.6%, a difference of 9.1%).
| Demographics | Rating | Rank | Female Unemployment |
| Menominee | 0.0 /100 | #333 | Tragic 7.0% |
| Immigrants | Armenia | 0.0 /100 | #334 | Tragic 7.1% |
| Dominicans | 0.0 /100 | #335 | Tragic 7.2% |
| Immigrants | Dominican Republic | 0.0 /100 | #336 | Tragic 7.2% |
| Navajo | 0.0 /100 | #337 | Tragic 7.3% |
| Tohono O'odham | 0.0 /100 | #338 | Tragic 7.7% |
| Immigrants | Yemen | 0.0 /100 | #339 | Tragic 7.8% |
| Hopi | 0.0 /100 | #340 | Tragic 8.1% |
| Inupiat | 0.0 /100 | #341 | Tragic 8.2% |
| Puerto Ricans | 0.0 /100 | #342 | Tragic 8.3% |
| Arapaho | 0.0 /100 | #343 | Tragic 8.8% |
| Pima | 0.0 /100 | #344 | Tragic 9.3% |
| Yuman | 0.0 /100 | #345 | Tragic 9.6% |
| Yup'ik | 0.0 /100 | #346 | Tragic 10.9% |
| Crow | 0.0 /100 | #347 | Tragic 12.1% |