Choctaw vs Immigrants from Iran In Labor Force | Age 25-29
COMPARE
Choctaw
Immigrants from Iran
In Labor Force | Age 25-29
In Labor Force | Age 25-29 Comparison
Choctaw
Immigrants from Iran
81.0%
IN LABOR FORCE | AGE 25-29
0.0/ 100
METRIC RATING
326th/ 347
METRIC RANK
84.9%
IN LABOR FORCE | AGE 25-29
84.8/ 100
METRIC RATING
124th/ 347
METRIC RANK
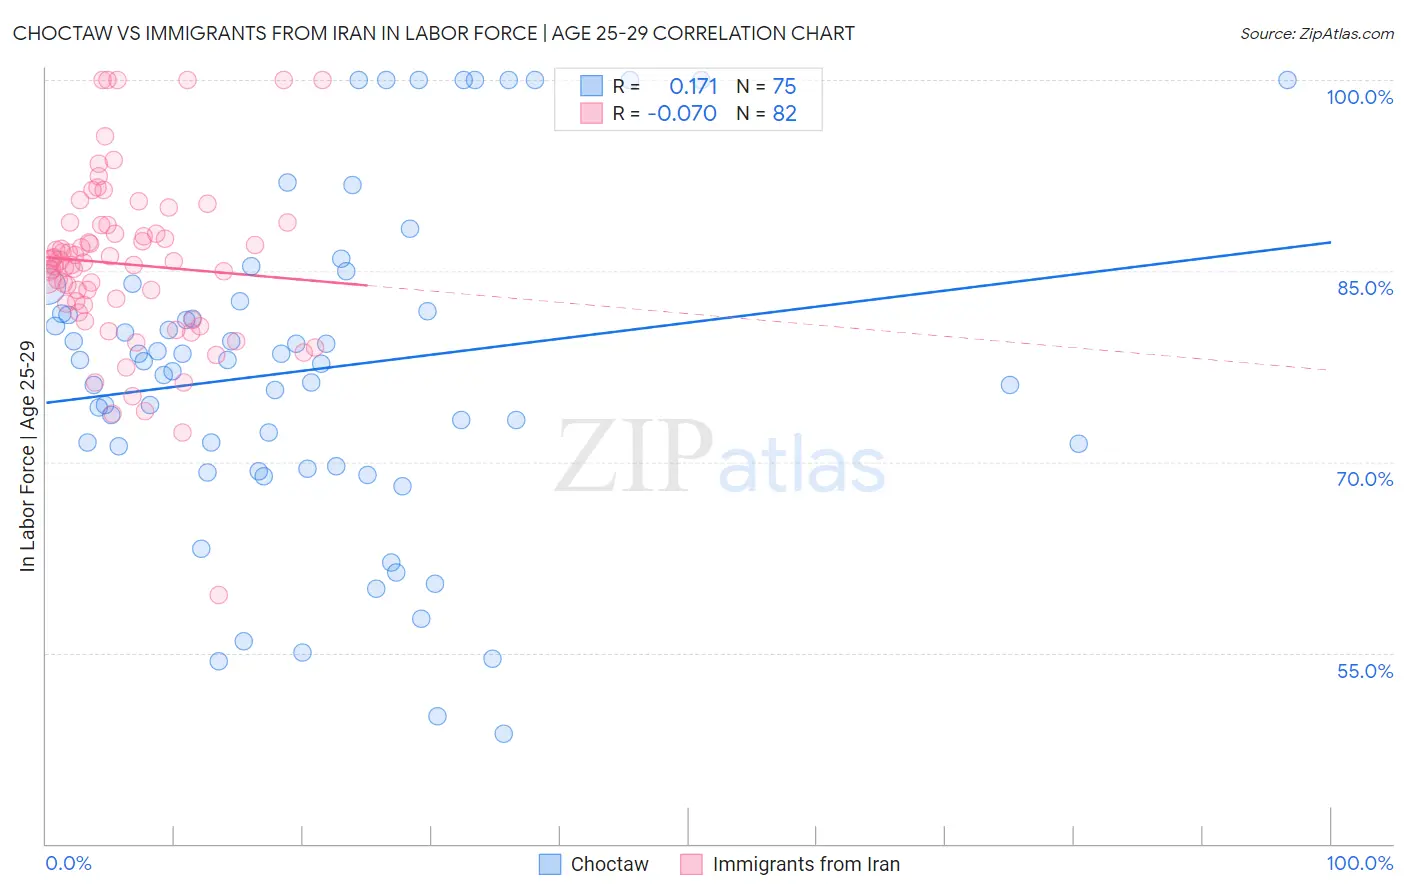
Choctaw vs Immigrants from Iran In Labor Force | Age 25-29 Correlation Chart
The statistical analysis conducted on geographies consisting of 269,623,280 people shows a poor positive correlation between the proportion of Choctaw and labor force participation rate among population between the ages 25 and 29 in the United States with a correlation coefficient (R) of 0.171 and weighted average of 81.0%. Similarly, the statistical analysis conducted on geographies consisting of 279,858,438 people shows a slight negative correlation between the proportion of Immigrants from Iran and labor force participation rate among population between the ages 25 and 29 in the United States with a correlation coefficient (R) of -0.070 and weighted average of 84.9%, a difference of 4.9%.
In Labor Force | Age 25-29 Correlation Summary
| Measurement | Choctaw | Immigrants from Iran |
| Minimum | 48.6% | 59.5% |
| Maximum | 100.0% | 100.0% |
| Range | 51.4% | 40.5% |
| Mean | 77.3% | 85.5% |
| Median | 77.9% | 85.7% |
| Interquartile 25% (IQ1) | 69.7% | 82.3% |
| Interquartile 75% (IQ3) | 82.6% | 88.6% |
| Interquartile Range (IQR) | 12.9% | 6.3% |
| Standard Deviation (Sample) | 12.8% | 6.8% |
| Standard Deviation (Population) | 12.7% | 6.7% |
Similar Demographics by In Labor Force | Age 25-29
Demographics Similar to Choctaw by In Labor Force | Age 25-29
In terms of in labor force | age 25-29, the demographic groups most similar to Choctaw are Dutch West Indian (81.1%, a difference of 0.20%), Ute (80.8%, a difference of 0.20%), Houma (81.2%, a difference of 0.32%), Creek (80.7%, a difference of 0.35%), and Yakama (80.6%, a difference of 0.46%).
| Demographics | Rating | Rank | In Labor Force | Age 25-29 |
| Seminole | 0.0 /100 | #319 | Tragic 81.7% |
| Colville | 0.0 /100 | #320 | Tragic 81.6% |
| Shoshone | 0.0 /100 | #321 | Tragic 81.6% |
| Kiowa | 0.0 /100 | #322 | Tragic 81.6% |
| Alaska Natives | 0.0 /100 | #323 | Tragic 81.6% |
| Houma | 0.0 /100 | #324 | Tragic 81.2% |
| Dutch West Indians | 0.0 /100 | #325 | Tragic 81.1% |
| Choctaw | 0.0 /100 | #326 | Tragic 81.0% |
| Ute | 0.0 /100 | #327 | Tragic 80.8% |
| Creek | 0.0 /100 | #328 | Tragic 80.7% |
| Yakama | 0.0 /100 | #329 | Tragic 80.6% |
| Puerto Ricans | 0.0 /100 | #330 | Tragic 80.4% |
| Cheyenne | 0.0 /100 | #331 | Tragic 80.3% |
| Inupiat | 0.0 /100 | #332 | Tragic 79.8% |
| Sioux | 0.0 /100 | #333 | Tragic 79.7% |
Demographics Similar to Immigrants from Iran by In Labor Force | Age 25-29
In terms of in labor force | age 25-29, the demographic groups most similar to Immigrants from Iran are Scandinavian (84.9%, a difference of 0.0%), Dutch (84.9%, a difference of 0.0%), Uruguayan (84.9%, a difference of 0.0%), Immigrants from Chile (84.9%, a difference of 0.010%), and Immigrants from Singapore (84.9%, a difference of 0.010%).
| Demographics | Rating | Rank | In Labor Force | Age 25-29 |
| Immigrants | Belarus | 88.0 /100 | #117 | Excellent 85.0% |
| Finns | 87.8 /100 | #118 | Excellent 85.0% |
| Filipinos | 87.1 /100 | #119 | Excellent 84.9% |
| Immigrants | South Africa | 86.1 /100 | #120 | Excellent 84.9% |
| Immigrants | Chile | 85.6 /100 | #121 | Excellent 84.9% |
| Scandinavians | 85.1 /100 | #122 | Excellent 84.9% |
| Dutch | 84.9 /100 | #123 | Excellent 84.9% |
| Immigrants | Iran | 84.8 /100 | #124 | Excellent 84.9% |
| Uruguayans | 84.7 /100 | #125 | Excellent 84.9% |
| Immigrants | Singapore | 84.4 /100 | #126 | Excellent 84.9% |
| Immigrants | Uruguay | 84.0 /100 | #127 | Excellent 84.9% |
| Australians | 83.6 /100 | #128 | Excellent 84.9% |
| Immigrants | Russia | 81.6 /100 | #129 | Excellent 84.9% |
| Northern Europeans | 81.3 /100 | #130 | Excellent 84.9% |
| Iranians | 78.1 /100 | #131 | Good 84.8% |