Choctaw vs West Indian In Labor Force | Age 25-29
COMPARE
Choctaw
West Indian
In Labor Force | Age 25-29
In Labor Force | Age 25-29 Comparison
Choctaw
West Indians
81.0%
IN LABOR FORCE | AGE 25-29
0.0/ 100
METRIC RATING
326th/ 347
METRIC RANK
83.5%
IN LABOR FORCE | AGE 25-29
0.1/ 100
METRIC RATING
263rd/ 347
METRIC RANK
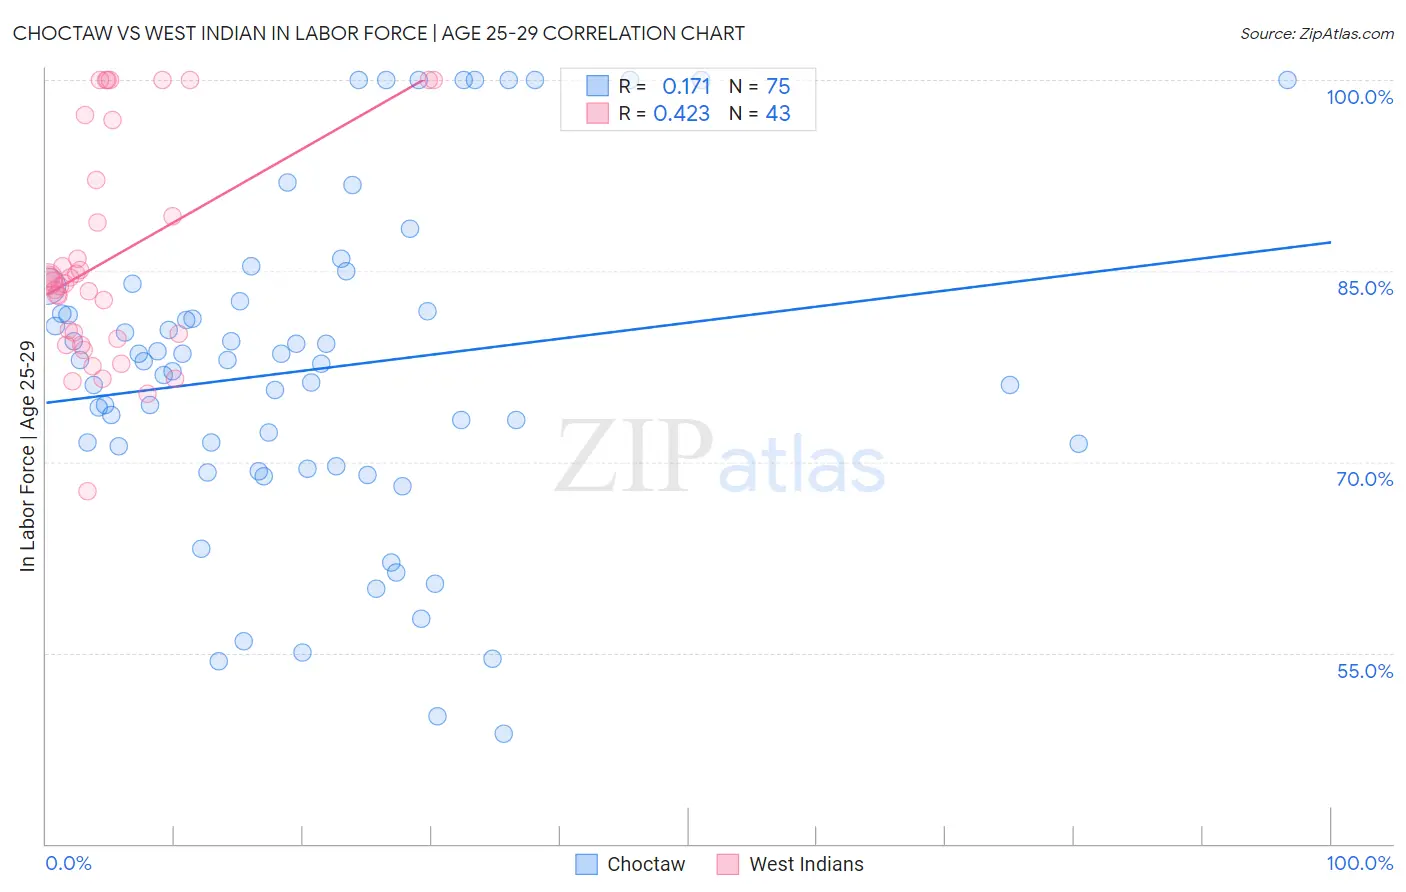
Choctaw vs West Indian In Labor Force | Age 25-29 Correlation Chart
The statistical analysis conducted on geographies consisting of 269,623,280 people shows a poor positive correlation between the proportion of Choctaw and labor force participation rate among population between the ages 25 and 29 in the United States with a correlation coefficient (R) of 0.171 and weighted average of 81.0%. Similarly, the statistical analysis conducted on geographies consisting of 254,002,174 people shows a moderate positive correlation between the proportion of West Indians and labor force participation rate among population between the ages 25 and 29 in the United States with a correlation coefficient (R) of 0.423 and weighted average of 83.5%, a difference of 3.2%.
In Labor Force | Age 25-29 Correlation Summary
| Measurement | Choctaw | West Indian |
| Minimum | 48.6% | 67.7% |
| Maximum | 100.0% | 100.0% |
| Range | 51.4% | 32.3% |
| Mean | 77.3% | 86.0% |
| Median | 77.9% | 84.2% |
| Interquartile 25% (IQ1) | 69.7% | 79.7% |
| Interquartile 75% (IQ3) | 82.6% | 92.1% |
| Interquartile Range (IQR) | 12.9% | 12.4% |
| Standard Deviation (Sample) | 12.8% | 8.6% |
| Standard Deviation (Population) | 12.7% | 8.5% |
Similar Demographics by In Labor Force | Age 25-29
Demographics Similar to Choctaw by In Labor Force | Age 25-29
In terms of in labor force | age 25-29, the demographic groups most similar to Choctaw are Dutch West Indian (81.1%, a difference of 0.20%), Ute (80.8%, a difference of 0.20%), Houma (81.2%, a difference of 0.32%), Creek (80.7%, a difference of 0.35%), and Yakama (80.6%, a difference of 0.46%).
| Demographics | Rating | Rank | In Labor Force | Age 25-29 |
| Seminole | 0.0 /100 | #319 | Tragic 81.7% |
| Colville | 0.0 /100 | #320 | Tragic 81.6% |
| Shoshone | 0.0 /100 | #321 | Tragic 81.6% |
| Kiowa | 0.0 /100 | #322 | Tragic 81.6% |
| Alaska Natives | 0.0 /100 | #323 | Tragic 81.6% |
| Houma | 0.0 /100 | #324 | Tragic 81.2% |
| Dutch West Indians | 0.0 /100 | #325 | Tragic 81.1% |
| Choctaw | 0.0 /100 | #326 | Tragic 81.0% |
| Ute | 0.0 /100 | #327 | Tragic 80.8% |
| Creek | 0.0 /100 | #328 | Tragic 80.7% |
| Yakama | 0.0 /100 | #329 | Tragic 80.6% |
| Puerto Ricans | 0.0 /100 | #330 | Tragic 80.4% |
| Cheyenne | 0.0 /100 | #331 | Tragic 80.3% |
| Inupiat | 0.0 /100 | #332 | Tragic 79.8% |
| Sioux | 0.0 /100 | #333 | Tragic 79.7% |
Demographics Similar to West Indians by In Labor Force | Age 25-29
In terms of in labor force | age 25-29, the demographic groups most similar to West Indians are Immigrants from Fiji (83.6%, a difference of 0.040%), Puget Sound Salish (83.5%, a difference of 0.060%), Cuban (83.5%, a difference of 0.060%), Aleut (83.4%, a difference of 0.10%), and Immigrants from Bahamas (83.6%, a difference of 0.11%).
| Demographics | Rating | Rank | In Labor Force | Age 25-29 |
| Immigrants | Haiti | 0.2 /100 | #256 | Tragic 83.7% |
| Delaware | 0.2 /100 | #257 | Tragic 83.7% |
| Immigrants | Guatemala | 0.1 /100 | #258 | Tragic 83.6% |
| Spanish | 0.1 /100 | #259 | Tragic 83.6% |
| Immigrants | Bahamas | 0.1 /100 | #260 | Tragic 83.6% |
| Pennsylvania Germans | 0.1 /100 | #261 | Tragic 83.6% |
| Immigrants | Fiji | 0.1 /100 | #262 | Tragic 83.6% |
| West Indians | 0.1 /100 | #263 | Tragic 83.5% |
| Puget Sound Salish | 0.1 /100 | #264 | Tragic 83.5% |
| Cubans | 0.1 /100 | #265 | Tragic 83.5% |
| Aleuts | 0.0 /100 | #266 | Tragic 83.4% |
| Spanish Americans | 0.0 /100 | #267 | Tragic 83.4% |
| Immigrants | Lebanon | 0.0 /100 | #268 | Tragic 83.4% |
| Immigrants | Barbados | 0.0 /100 | #269 | Tragic 83.4% |
| Basques | 0.0 /100 | #270 | Tragic 83.4% |