Choctaw vs Immigrants from Iran Master's Degree
COMPARE
Choctaw
Immigrants from Iran
Master's Degree
Master's Degree Comparison
Choctaw
Immigrants from Iran
11.0%
MASTER'S DEGREE
0.0/ 100
METRIC RATING
312th/ 347
METRIC RANK
21.6%
MASTER'S DEGREE
100.0/ 100
METRIC RATING
10th/ 347
METRIC RANK
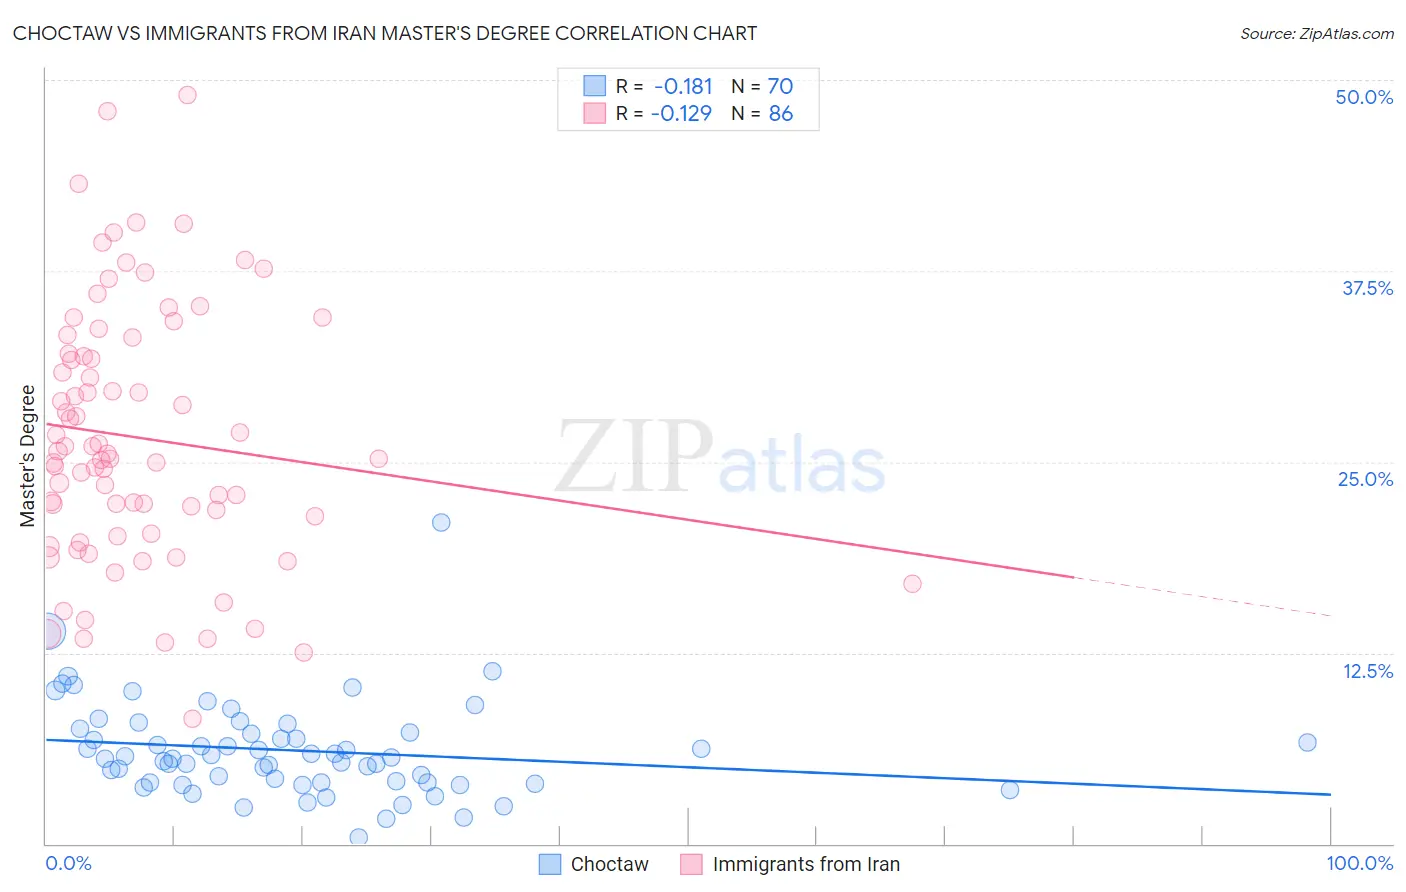
Choctaw vs Immigrants from Iran Master's Degree Correlation Chart
The statistical analysis conducted on geographies consisting of 269,630,236 people shows a poor negative correlation between the proportion of Choctaw and percentage of population with at least master's degree education in the United States with a correlation coefficient (R) of -0.181 and weighted average of 11.0%. Similarly, the statistical analysis conducted on geographies consisting of 279,879,707 people shows a poor negative correlation between the proportion of Immigrants from Iran and percentage of population with at least master's degree education in the United States with a correlation coefficient (R) of -0.129 and weighted average of 21.6%, a difference of 96.1%.
Master's Degree Correlation Summary
| Measurement | Choctaw | Immigrants from Iran |
| Minimum | 0.41% | 8.2% |
| Maximum | 21.0% | 49.0% |
| Range | 20.6% | 40.8% |
| Mean | 6.1% | 26.6% |
| Median | 5.6% | 25.4% |
| Interquartile 25% (IQ1) | 4.0% | 20.3% |
| Interquartile 75% (IQ3) | 7.3% | 32.1% |
| Interquartile Range (IQR) | 3.3% | 11.8% |
| Standard Deviation (Sample) | 3.2% | 8.4% |
| Standard Deviation (Population) | 3.1% | 8.4% |
Similar Demographics by Master's Degree
Demographics Similar to Choctaw by Master's Degree
In terms of master's degree, the demographic groups most similar to Choctaw are Seminole (11.0%, a difference of 0.10%), Yaqui (11.0%, a difference of 0.18%), Cajun (11.0%, a difference of 0.57%), Apache (11.0%, a difference of 0.58%), and Shoshone (11.1%, a difference of 0.61%).
| Demographics | Rating | Rank | Master's Degree |
| Immigrants | Latin America | 0.0 /100 | #305 | Tragic 11.3% |
| Mexican American Indians | 0.0 /100 | #306 | Tragic 11.2% |
| Cheyenne | 0.0 /100 | #307 | Tragic 11.2% |
| Puerto Ricans | 0.0 /100 | #308 | Tragic 11.2% |
| Puget Sound Salish | 0.0 /100 | #309 | Tragic 11.1% |
| Shoshone | 0.0 /100 | #310 | Tragic 11.1% |
| Seminole | 0.0 /100 | #311 | Tragic 11.0% |
| Choctaw | 0.0 /100 | #312 | Tragic 11.0% |
| Yaqui | 0.0 /100 | #313 | Tragic 11.0% |
| Cajuns | 0.0 /100 | #314 | Tragic 11.0% |
| Apache | 0.0 /100 | #315 | Tragic 11.0% |
| Hispanics or Latinos | 0.0 /100 | #316 | Tragic 10.9% |
| Hopi | 0.0 /100 | #317 | Tragic 10.9% |
| Immigrants | Cuba | 0.0 /100 | #318 | Tragic 10.9% |
| Kiowa | 0.0 /100 | #319 | Tragic 10.8% |
Demographics Similar to Immigrants from Iran by Master's Degree
In terms of master's degree, the demographic groups most similar to Immigrants from Iran are Thai (21.7%, a difference of 0.41%), Cypriot (21.8%, a difference of 0.75%), Immigrants from China (21.2%, a difference of 2.1%), Eastern European (21.1%, a difference of 2.4%), and Iranian (22.3%, a difference of 3.0%).
| Demographics | Rating | Rank | Master's Degree |
| Immigrants | Israel | 100.0 /100 | #3 | Exceptional 22.6% |
| Okinawans | 100.0 /100 | #4 | Exceptional 22.6% |
| Immigrants | Taiwan | 100.0 /100 | #5 | Exceptional 22.5% |
| Immigrants | India | 100.0 /100 | #6 | Exceptional 22.3% |
| Iranians | 100.0 /100 | #7 | Exceptional 22.3% |
| Cypriots | 100.0 /100 | #8 | Exceptional 21.8% |
| Thais | 100.0 /100 | #9 | Exceptional 21.7% |
| Immigrants | Iran | 100.0 /100 | #10 | Exceptional 21.6% |
| Immigrants | China | 100.0 /100 | #11 | Exceptional 21.2% |
| Eastern Europeans | 100.0 /100 | #12 | Exceptional 21.1% |
| Immigrants | Australia | 100.0 /100 | #13 | Exceptional 20.9% |
| Immigrants | Switzerland | 100.0 /100 | #14 | Exceptional 20.9% |
| Immigrants | Eastern Asia | 100.0 /100 | #15 | Exceptional 20.8% |
| Immigrants | Belgium | 100.0 /100 | #16 | Exceptional 20.8% |
| Immigrants | South Central Asia | 100.0 /100 | #17 | Exceptional 20.7% |