Alaskan Athabascan vs Immigrants from Iran In Labor Force | Age 25-29
COMPARE
Alaskan Athabascan
Immigrants from Iran
In Labor Force | Age 25-29
In Labor Force | Age 25-29 Comparison
Alaskan Athabascans
Immigrants from Iran
82.3%
IN LABOR FORCE | AGE 25-29
0.0/ 100
METRIC RATING
311th/ 347
METRIC RANK
84.9%
IN LABOR FORCE | AGE 25-29
84.8/ 100
METRIC RATING
124th/ 347
METRIC RANK
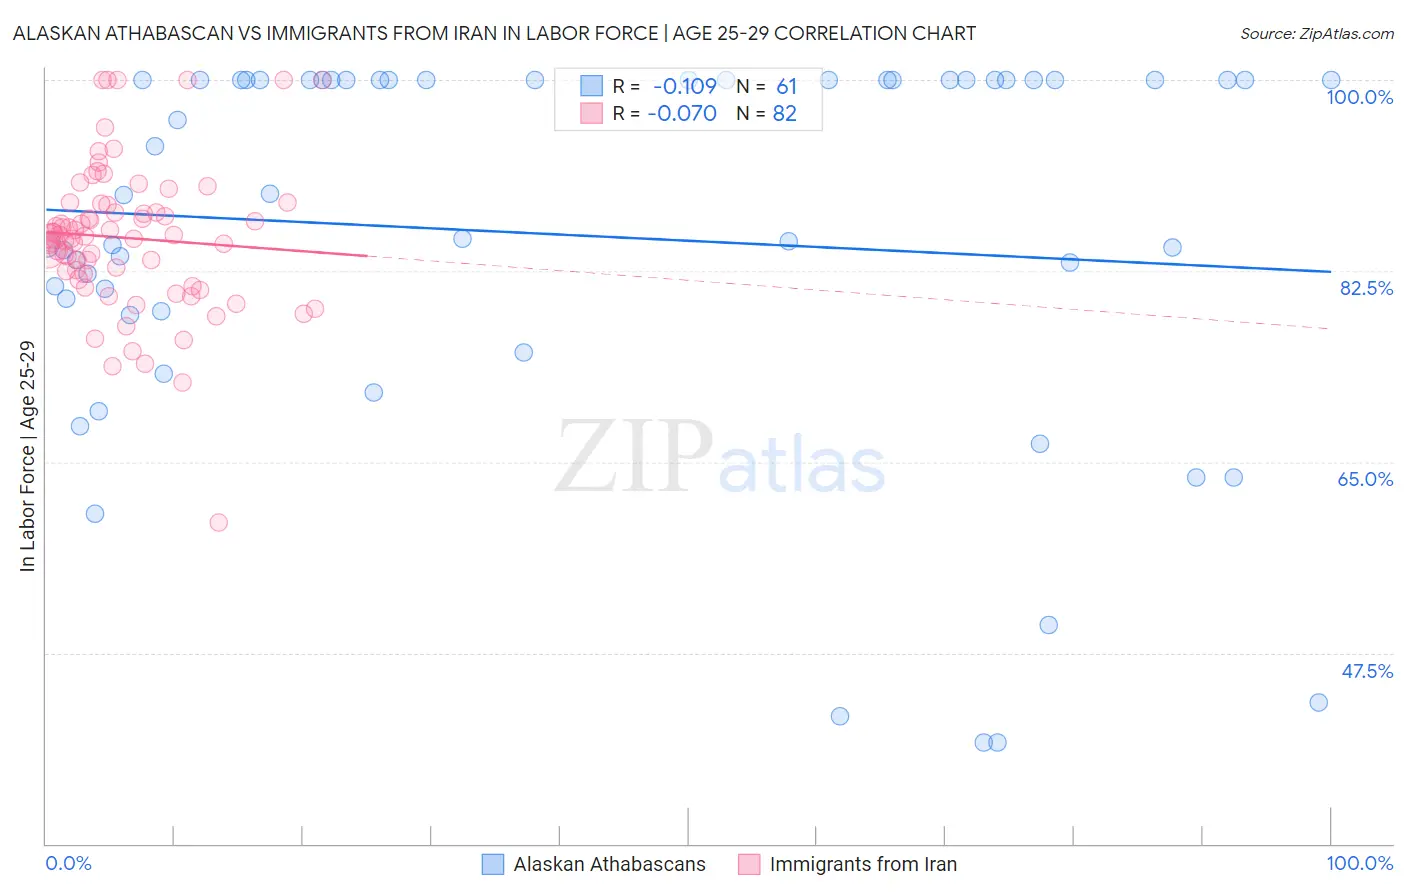
Alaskan Athabascan vs Immigrants from Iran In Labor Force | Age 25-29 Correlation Chart
The statistical analysis conducted on geographies consisting of 45,810,545 people shows a poor negative correlation between the proportion of Alaskan Athabascans and labor force participation rate among population between the ages 25 and 29 in the United States with a correlation coefficient (R) of -0.109 and weighted average of 82.3%. Similarly, the statistical analysis conducted on geographies consisting of 279,858,438 people shows a slight negative correlation between the proportion of Immigrants from Iran and labor force participation rate among population between the ages 25 and 29 in the United States with a correlation coefficient (R) of -0.070 and weighted average of 84.9%, a difference of 3.2%.
In Labor Force | Age 25-29 Correlation Summary
| Measurement | Alaskan Athabascan | Immigrants from Iran |
| Minimum | 39.3% | 59.5% |
| Maximum | 100.0% | 100.0% |
| Range | 60.7% | 40.5% |
| Mean | 85.8% | 85.5% |
| Median | 89.5% | 85.7% |
| Interquartile 25% (IQ1) | 78.6% | 82.3% |
| Interquartile 75% (IQ3) | 100.0% | 88.6% |
| Interquartile Range (IQR) | 21.4% | 6.3% |
| Standard Deviation (Sample) | 17.6% | 6.8% |
| Standard Deviation (Population) | 17.4% | 6.7% |
Similar Demographics by In Labor Force | Age 25-29
Demographics Similar to Alaskan Athabascans by In Labor Force | Age 25-29
In terms of in labor force | age 25-29, the demographic groups most similar to Alaskan Athabascans are Osage (82.3%, a difference of 0.010%), Hispanic or Latino (82.2%, a difference of 0.070%), Immigrants from Central America (82.4%, a difference of 0.15%), Central American Indian (82.4%, a difference of 0.16%), and Yaqui (82.2%, a difference of 0.17%).
| Demographics | Rating | Rank | In Labor Force | Age 25-29 |
| Immigrants | St. Vincent and the Grenadines | 0.0 /100 | #304 | Tragic 82.7% |
| Blacks/African Americans | 0.0 /100 | #305 | Tragic 82.6% |
| Blackfeet | 0.0 /100 | #306 | Tragic 82.6% |
| Cajuns | 0.0 /100 | #307 | Tragic 82.5% |
| Central American Indians | 0.0 /100 | #308 | Tragic 82.4% |
| Immigrants | Central America | 0.0 /100 | #309 | Tragic 82.4% |
| Osage | 0.0 /100 | #310 | Tragic 82.3% |
| Alaskan Athabascans | 0.0 /100 | #311 | Tragic 82.3% |
| Hispanics or Latinos | 0.0 /100 | #312 | Tragic 82.2% |
| Yaqui | 0.0 /100 | #313 | Tragic 82.2% |
| Cherokee | 0.0 /100 | #314 | Tragic 82.1% |
| Immigrants | Mexico | 0.0 /100 | #315 | Tragic 82.0% |
| Mexicans | 0.0 /100 | #316 | Tragic 81.9% |
| Chickasaw | 0.0 /100 | #317 | Tragic 81.9% |
| Comanche | 0.0 /100 | #318 | Tragic 81.9% |
Demographics Similar to Immigrants from Iran by In Labor Force | Age 25-29
In terms of in labor force | age 25-29, the demographic groups most similar to Immigrants from Iran are Scandinavian (84.9%, a difference of 0.0%), Dutch (84.9%, a difference of 0.0%), Uruguayan (84.9%, a difference of 0.0%), Immigrants from Chile (84.9%, a difference of 0.010%), and Immigrants from Singapore (84.9%, a difference of 0.010%).
| Demographics | Rating | Rank | In Labor Force | Age 25-29 |
| Immigrants | Belarus | 88.0 /100 | #117 | Excellent 85.0% |
| Finns | 87.8 /100 | #118 | Excellent 85.0% |
| Filipinos | 87.1 /100 | #119 | Excellent 84.9% |
| Immigrants | South Africa | 86.1 /100 | #120 | Excellent 84.9% |
| Immigrants | Chile | 85.6 /100 | #121 | Excellent 84.9% |
| Scandinavians | 85.1 /100 | #122 | Excellent 84.9% |
| Dutch | 84.9 /100 | #123 | Excellent 84.9% |
| Immigrants | Iran | 84.8 /100 | #124 | Excellent 84.9% |
| Uruguayans | 84.7 /100 | #125 | Excellent 84.9% |
| Immigrants | Singapore | 84.4 /100 | #126 | Excellent 84.9% |
| Immigrants | Uruguay | 84.0 /100 | #127 | Excellent 84.9% |
| Australians | 83.6 /100 | #128 | Excellent 84.9% |
| Immigrants | Russia | 81.6 /100 | #129 | Excellent 84.9% |
| Northern Europeans | 81.3 /100 | #130 | Excellent 84.9% |
| Iranians | 78.1 /100 | #131 | Good 84.8% |