Choctaw vs Moroccan In Labor Force | Age 25-29
COMPARE
Choctaw
Moroccan
In Labor Force | Age 25-29
In Labor Force | Age 25-29 Comparison
Choctaw
Moroccans
81.0%
IN LABOR FORCE | AGE 25-29
0.0/ 100
METRIC RATING
326th/ 347
METRIC RANK
84.5%
IN LABOR FORCE | AGE 25-29
32.6/ 100
METRIC RATING
189th/ 347
METRIC RANK
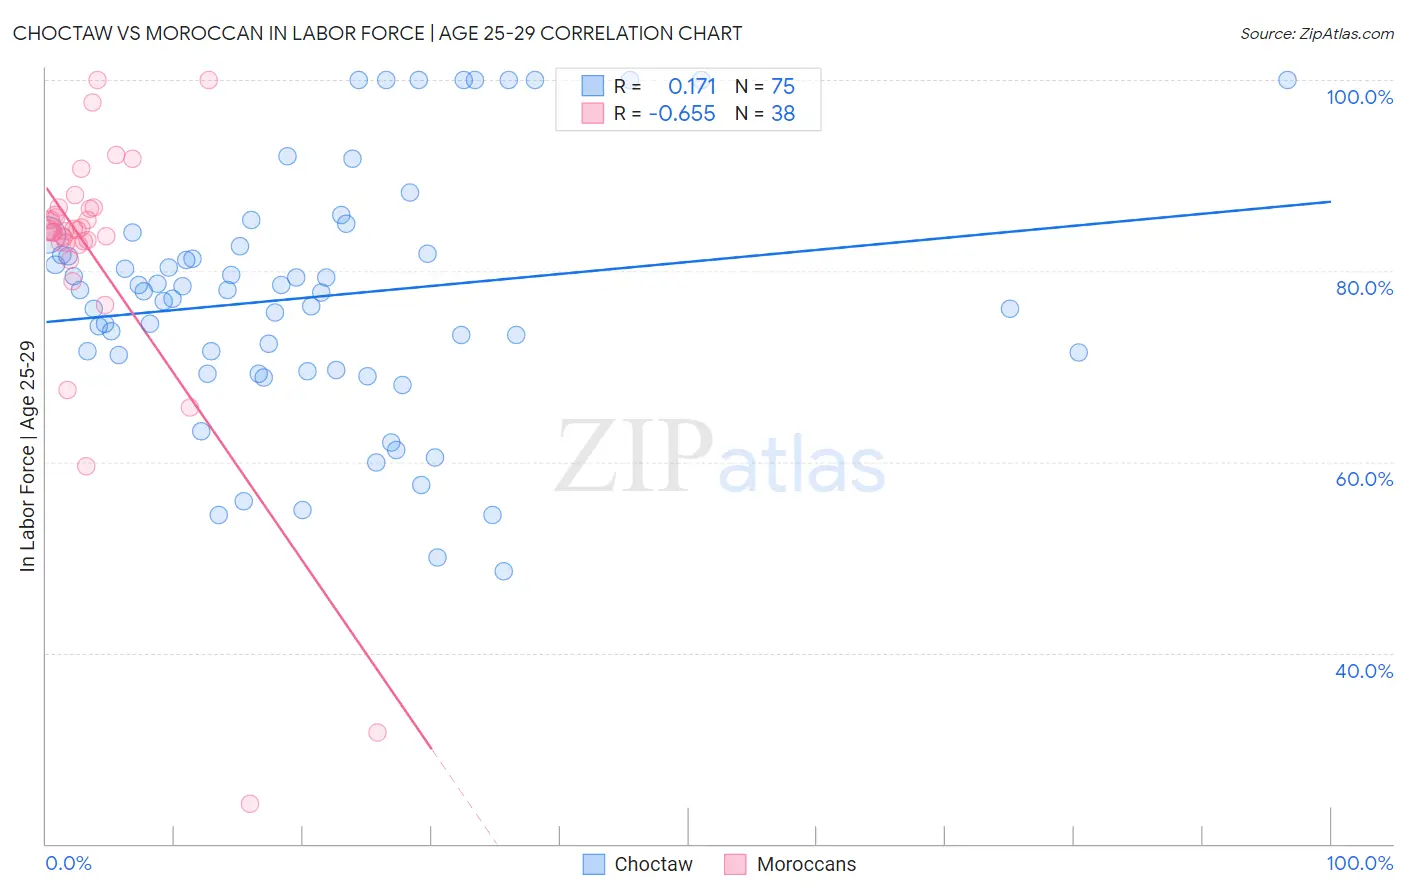
Choctaw vs Moroccan In Labor Force | Age 25-29 Correlation Chart
The statistical analysis conducted on geographies consisting of 269,623,280 people shows a poor positive correlation between the proportion of Choctaw and labor force participation rate among population between the ages 25 and 29 in the United States with a correlation coefficient (R) of 0.171 and weighted average of 81.0%. Similarly, the statistical analysis conducted on geographies consisting of 201,777,883 people shows a significant negative correlation between the proportion of Moroccans and labor force participation rate among population between the ages 25 and 29 in the United States with a correlation coefficient (R) of -0.655 and weighted average of 84.5%, a difference of 4.4%.
In Labor Force | Age 25-29 Correlation Summary
| Measurement | Choctaw | Moroccan |
| Minimum | 48.6% | 24.2% |
| Maximum | 100.0% | 100.0% |
| Range | 51.4% | 75.8% |
| Mean | 77.3% | 81.2% |
| Median | 77.9% | 84.2% |
| Interquartile 25% (IQ1) | 69.7% | 83.0% |
| Interquartile 75% (IQ3) | 82.6% | 86.5% |
| Interquartile Range (IQR) | 12.9% | 3.5% |
| Standard Deviation (Sample) | 12.8% | 14.9% |
| Standard Deviation (Population) | 12.7% | 14.7% |
Similar Demographics by In Labor Force | Age 25-29
Demographics Similar to Choctaw by In Labor Force | Age 25-29
In terms of in labor force | age 25-29, the demographic groups most similar to Choctaw are Dutch West Indian (81.1%, a difference of 0.20%), Ute (80.8%, a difference of 0.20%), Houma (81.2%, a difference of 0.32%), Creek (80.7%, a difference of 0.35%), and Yakama (80.6%, a difference of 0.46%).
| Demographics | Rating | Rank | In Labor Force | Age 25-29 |
| Seminole | 0.0 /100 | #319 | Tragic 81.7% |
| Colville | 0.0 /100 | #320 | Tragic 81.6% |
| Shoshone | 0.0 /100 | #321 | Tragic 81.6% |
| Kiowa | 0.0 /100 | #322 | Tragic 81.6% |
| Alaska Natives | 0.0 /100 | #323 | Tragic 81.6% |
| Houma | 0.0 /100 | #324 | Tragic 81.2% |
| Dutch West Indians | 0.0 /100 | #325 | Tragic 81.1% |
| Choctaw | 0.0 /100 | #326 | Tragic 81.0% |
| Ute | 0.0 /100 | #327 | Tragic 80.8% |
| Creek | 0.0 /100 | #328 | Tragic 80.7% |
| Yakama | 0.0 /100 | #329 | Tragic 80.6% |
| Puerto Ricans | 0.0 /100 | #330 | Tragic 80.4% |
| Cheyenne | 0.0 /100 | #331 | Tragic 80.3% |
| Inupiat | 0.0 /100 | #332 | Tragic 79.8% |
| Sioux | 0.0 /100 | #333 | Tragic 79.7% |
Demographics Similar to Moroccans by In Labor Force | Age 25-29
In terms of in labor force | age 25-29, the demographic groups most similar to Moroccans are Immigrants from Ukraine (84.5%, a difference of 0.010%), Welsh (84.5%, a difference of 0.010%), Immigrants from Belgium (84.6%, a difference of 0.020%), Immigrants from Portugal (84.6%, a difference of 0.020%), and Zimbabwean (84.5%, a difference of 0.030%).
| Demographics | Rating | Rank | In Labor Force | Age 25-29 |
| Europeans | 40.3 /100 | #182 | Average 84.6% |
| Scottish | 40.1 /100 | #183 | Average 84.6% |
| Immigrants | Kuwait | 38.2 /100 | #184 | Fair 84.6% |
| Immigrants | Denmark | 37.0 /100 | #185 | Fair 84.6% |
| Immigrants | Belgium | 35.0 /100 | #186 | Fair 84.6% |
| Immigrants | Portugal | 34.7 /100 | #187 | Fair 84.6% |
| Immigrants | Ukraine | 33.7 /100 | #188 | Fair 84.5% |
| Moroccans | 32.6 /100 | #189 | Fair 84.5% |
| Welsh | 31.1 /100 | #190 | Fair 84.5% |
| Zimbabweans | 28.7 /100 | #191 | Fair 84.5% |
| English | 25.8 /100 | #192 | Fair 84.5% |
| South American Indians | 25.0 /100 | #193 | Fair 84.5% |
| Portuguese | 21.2 /100 | #194 | Fair 84.4% |
| Immigrants | Israel | 20.8 /100 | #195 | Fair 84.4% |
| Immigrants | South Eastern Asia | 19.5 /100 | #196 | Poor 84.4% |