Choctaw vs Immigrants from Costa Rica In Labor Force | Age 25-29
COMPARE
Choctaw
Immigrants from Costa Rica
In Labor Force | Age 25-29
In Labor Force | Age 25-29 Comparison
Choctaw
Immigrants from Costa Rica
81.0%
IN LABOR FORCE | AGE 25-29
0.0/ 100
METRIC RATING
326th/ 347
METRIC RANK
85.1%
IN LABOR FORCE | AGE 25-29
95.5/ 100
METRIC RATING
92nd/ 347
METRIC RANK
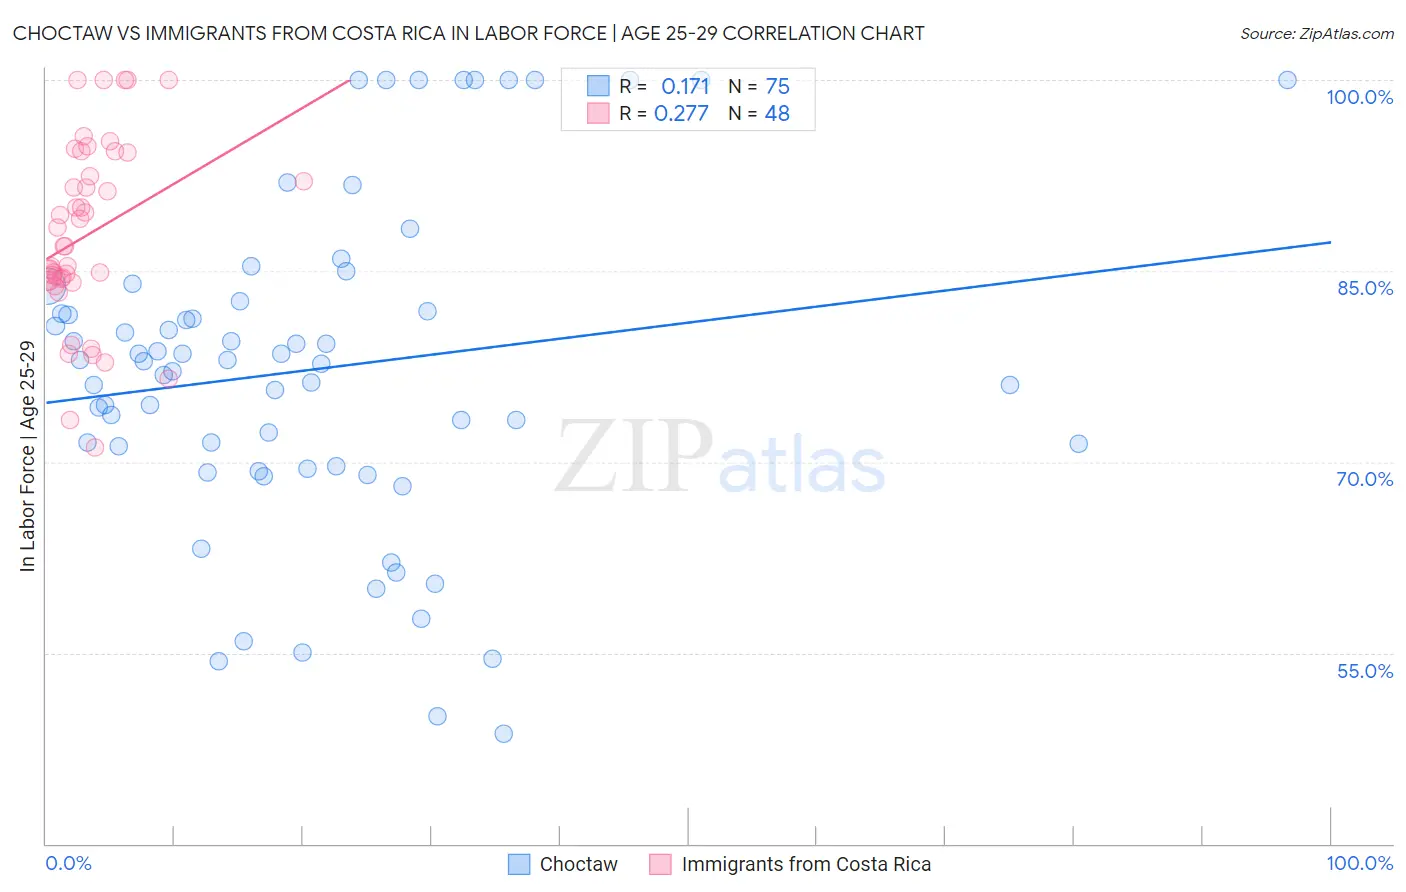
Choctaw vs Immigrants from Costa Rica In Labor Force | Age 25-29 Correlation Chart
The statistical analysis conducted on geographies consisting of 269,623,280 people shows a poor positive correlation between the proportion of Choctaw and labor force participation rate among population between the ages 25 and 29 in the United States with a correlation coefficient (R) of 0.171 and weighted average of 81.0%. Similarly, the statistical analysis conducted on geographies consisting of 204,268,697 people shows a weak positive correlation between the proportion of Immigrants from Costa Rica and labor force participation rate among population between the ages 25 and 29 in the United States with a correlation coefficient (R) of 0.277 and weighted average of 85.1%, a difference of 5.1%.
In Labor Force | Age 25-29 Correlation Summary
| Measurement | Choctaw | Immigrants from Costa Rica |
| Minimum | 48.6% | 71.1% |
| Maximum | 100.0% | 100.0% |
| Range | 51.4% | 28.9% |
| Mean | 77.3% | 87.8% |
| Median | 77.9% | 86.9% |
| Interquartile 25% (IQ1) | 69.7% | 84.3% |
| Interquartile 75% (IQ3) | 82.6% | 93.3% |
| Interquartile Range (IQR) | 12.9% | 9.0% |
| Standard Deviation (Sample) | 12.8% | 7.1% |
| Standard Deviation (Population) | 12.7% | 7.1% |
Similar Demographics by In Labor Force | Age 25-29
Demographics Similar to Choctaw by In Labor Force | Age 25-29
In terms of in labor force | age 25-29, the demographic groups most similar to Choctaw are Dutch West Indian (81.1%, a difference of 0.20%), Ute (80.8%, a difference of 0.20%), Houma (81.2%, a difference of 0.32%), Creek (80.7%, a difference of 0.35%), and Yakama (80.6%, a difference of 0.46%).
| Demographics | Rating | Rank | In Labor Force | Age 25-29 |
| Seminole | 0.0 /100 | #319 | Tragic 81.7% |
| Colville | 0.0 /100 | #320 | Tragic 81.6% |
| Shoshone | 0.0 /100 | #321 | Tragic 81.6% |
| Kiowa | 0.0 /100 | #322 | Tragic 81.6% |
| Alaska Natives | 0.0 /100 | #323 | Tragic 81.6% |
| Houma | 0.0 /100 | #324 | Tragic 81.2% |
| Dutch West Indians | 0.0 /100 | #325 | Tragic 81.1% |
| Choctaw | 0.0 /100 | #326 | Tragic 81.0% |
| Ute | 0.0 /100 | #327 | Tragic 80.8% |
| Creek | 0.0 /100 | #328 | Tragic 80.7% |
| Yakama | 0.0 /100 | #329 | Tragic 80.6% |
| Puerto Ricans | 0.0 /100 | #330 | Tragic 80.4% |
| Cheyenne | 0.0 /100 | #331 | Tragic 80.3% |
| Inupiat | 0.0 /100 | #332 | Tragic 79.8% |
| Sioux | 0.0 /100 | #333 | Tragic 79.7% |
Demographics Similar to Immigrants from Costa Rica by In Labor Force | Age 25-29
In terms of in labor force | age 25-29, the demographic groups most similar to Immigrants from Costa Rica are Immigrants from Moldova (85.1%, a difference of 0.010%), Austrian (85.1%, a difference of 0.010%), Burmese (85.1%, a difference of 0.020%), Immigrants from Korea (85.1%, a difference of 0.030%), and Immigrants from Croatia (85.2%, a difference of 0.040%).
| Demographics | Rating | Rank | In Labor Force | Age 25-29 |
| Immigrants | Africa | 96.7 /100 | #85 | Exceptional 85.2% |
| Ukrainians | 96.7 /100 | #86 | Exceptional 85.2% |
| French Canadians | 96.5 /100 | #87 | Exceptional 85.2% |
| Immigrants | Croatia | 96.4 /100 | #88 | Exceptional 85.2% |
| Immigrants | France | 96.3 /100 | #89 | Exceptional 85.2% |
| Burmese | 95.9 /100 | #90 | Exceptional 85.1% |
| Immigrants | Moldova | 95.8 /100 | #91 | Exceptional 85.1% |
| Immigrants | Costa Rica | 95.5 /100 | #92 | Exceptional 85.1% |
| Austrians | 95.3 /100 | #93 | Exceptional 85.1% |
| Immigrants | Korea | 94.8 /100 | #94 | Exceptional 85.1% |
| Immigrants | Netherlands | 94.6 /100 | #95 | Exceptional 85.1% |
| Immigrants | Romania | 94.6 /100 | #96 | Exceptional 85.1% |
| Immigrants | Sudan | 94.3 /100 | #97 | Exceptional 85.1% |
| Mongolians | 94.1 /100 | #98 | Exceptional 85.1% |
| Bangladeshis | 94.0 /100 | #99 | Exceptional 85.1% |