Choctaw vs Immigrants from Iran Unemployment Among Women with Children Ages 6 to 17 years
COMPARE
Choctaw
Immigrants from Iran
Unemployment Among Women with Children Ages 6 to 17 years
Unemployment Among Women with Children Ages 6 to 17 years Comparison
Choctaw
Immigrants from Iran
9.9%
UNEMPLOYMENT AMONG WOMEN WITH CHILDREN AGES 6 TO 17 YEARS
0.0/ 100
METRIC RATING
286th/ 347
METRIC RANK
7.9%
UNEMPLOYMENT AMONG WOMEN WITH CHILDREN AGES 6 TO 17 YEARS
100.0/ 100
METRIC RATING
30th/ 347
METRIC RANK
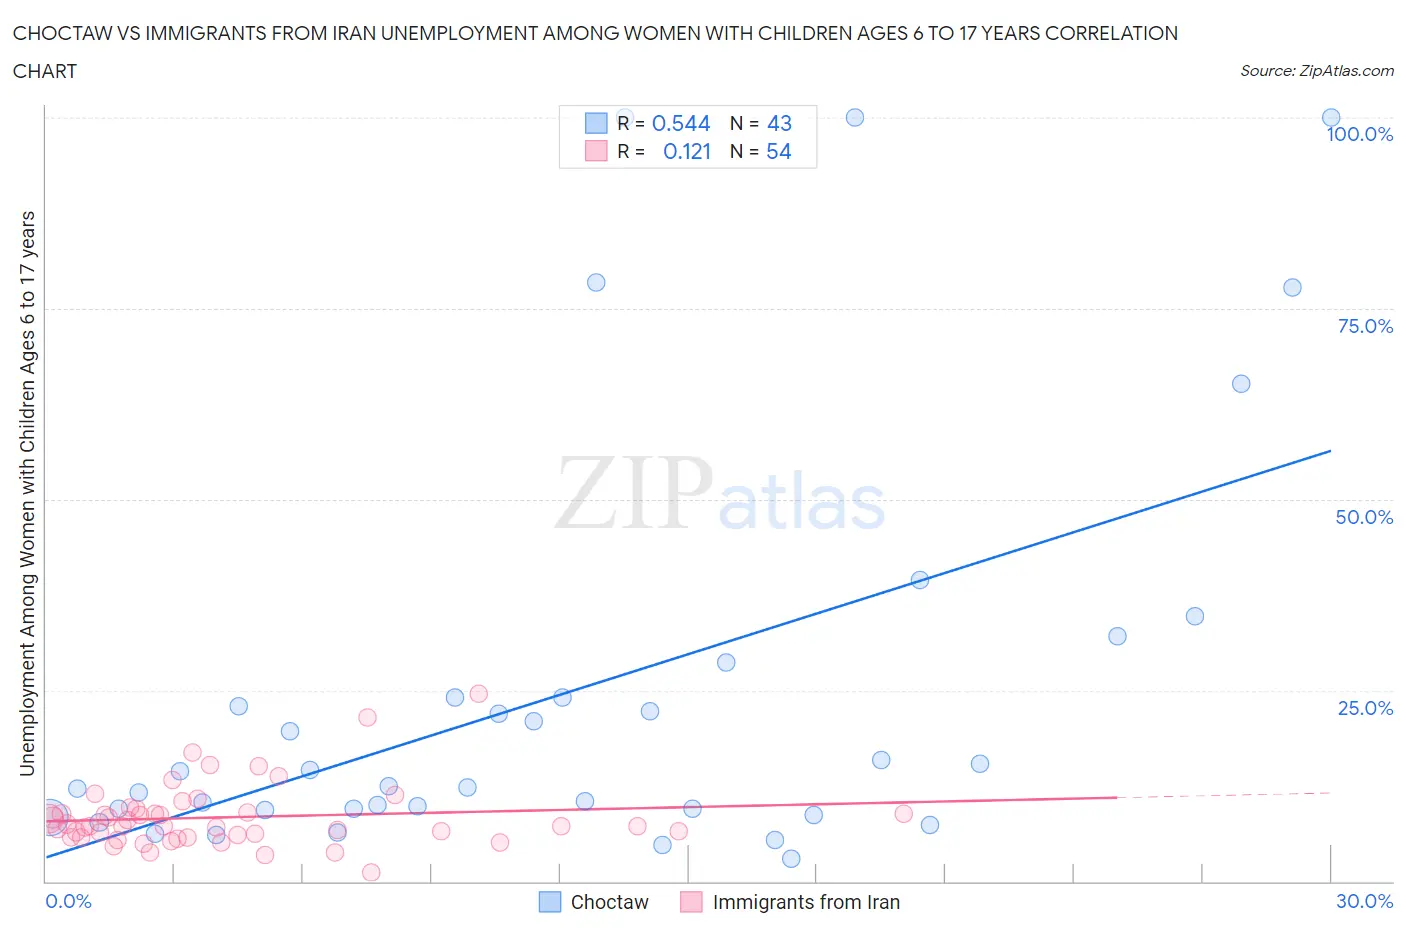
Choctaw vs Immigrants from Iran Unemployment Among Women with Children Ages 6 to 17 years Correlation Chart
The statistical analysis conducted on geographies consisting of 208,938,346 people shows a substantial positive correlation between the proportion of Choctaw and unemployment rate among women with children between the ages 6 and 17 in the United States with a correlation coefficient (R) of 0.544 and weighted average of 9.9%. Similarly, the statistical analysis conducted on geographies consisting of 214,519,414 people shows a poor positive correlation between the proportion of Immigrants from Iran and unemployment rate among women with children between the ages 6 and 17 in the United States with a correlation coefficient (R) of 0.121 and weighted average of 7.9%, a difference of 25.8%.
Unemployment Among Women with Children Ages 6 to 17 years Correlation Summary
| Measurement | Choctaw | Immigrants from Iran |
| Minimum | 2.9% | 1.2% |
| Maximum | 100.0% | 24.5% |
| Range | 97.1% | 23.3% |
| Mean | 24.7% | 8.4% |
| Median | 12.5% | 7.2% |
| Interquartile 25% (IQ1) | 9.3% | 5.8% |
| Interquartile 75% (IQ3) | 24.1% | 9.0% |
| Interquartile Range (IQR) | 14.7% | 3.2% |
| Standard Deviation (Sample) | 27.1% | 4.2% |
| Standard Deviation (Population) | 26.8% | 4.2% |
Similar Demographics by Unemployment Among Women with Children Ages 6 to 17 years
Demographics Similar to Choctaw by Unemployment Among Women with Children Ages 6 to 17 years
In terms of unemployment among women with children ages 6 to 17 years, the demographic groups most similar to Choctaw are Sierra Leonean (9.9%, a difference of 0.050%), Hispanic or Latino (9.9%, a difference of 0.12%), Shoshone (10.0%, a difference of 0.29%), Yakama (9.9%, a difference of 0.43%), and Central American Indian (9.9%, a difference of 0.58%).
| Demographics | Rating | Rank | Unemployment Among Women with Children Ages 6 to 17 years |
| Scotch-Irish | 0.1 /100 | #279 | Tragic 9.7% |
| Seminole | 0.1 /100 | #280 | Tragic 9.7% |
| Jamaicans | 0.0 /100 | #281 | Tragic 9.8% |
| Slovaks | 0.0 /100 | #282 | Tragic 9.8% |
| Central American Indians | 0.0 /100 | #283 | Tragic 9.9% |
| Yakama | 0.0 /100 | #284 | Tragic 9.9% |
| Hispanics or Latinos | 0.0 /100 | #285 | Tragic 9.9% |
| Choctaw | 0.0 /100 | #286 | Tragic 9.9% |
| Sierra Leoneans | 0.0 /100 | #287 | Tragic 9.9% |
| Shoshone | 0.0 /100 | #288 | Tragic 10.0% |
| Hondurans | 0.0 /100 | #289 | Tragic 10.0% |
| Sub-Saharan Africans | 0.0 /100 | #290 | Tragic 10.0% |
| Immigrants | Nonimmigrants | 0.0 /100 | #291 | Tragic 10.0% |
| Carpatho Rusyns | 0.0 /100 | #292 | Tragic 10.0% |
| Haitians | 0.0 /100 | #293 | Tragic 10.0% |
Demographics Similar to Immigrants from Iran by Unemployment Among Women with Children Ages 6 to 17 years
In terms of unemployment among women with children ages 6 to 17 years, the demographic groups most similar to Immigrants from Iran are Laotian (7.9%, a difference of 0.19%), Immigrants from Cambodia (7.9%, a difference of 0.24%), Immigrants from Korea (7.9%, a difference of 0.29%), Native Hawaiian (7.9%, a difference of 0.58%), and Immigrants from South Central Asia (7.9%, a difference of 0.68%).
| Demographics | Rating | Rank | Unemployment Among Women with Children Ages 6 to 17 years |
| Immigrants | Indonesia | 100.0 /100 | #23 | Exceptional 7.7% |
| Nepalese | 100.0 /100 | #24 | Exceptional 7.7% |
| Immigrants | Eastern Asia | 100.0 /100 | #25 | Exceptional 7.7% |
| Indians (Asian) | 100.0 /100 | #26 | Exceptional 7.7% |
| Immigrants | Afghanistan | 100.0 /100 | #27 | Exceptional 7.8% |
| Immigrants | Uzbekistan | 100.0 /100 | #28 | Exceptional 7.8% |
| Thais | 100.0 /100 | #29 | Exceptional 7.8% |
| Immigrants | Iran | 100.0 /100 | #30 | Exceptional 7.9% |
| Laotians | 100.0 /100 | #31 | Exceptional 7.9% |
| Immigrants | Cambodia | 100.0 /100 | #32 | Exceptional 7.9% |
| Immigrants | Korea | 100.0 /100 | #33 | Exceptional 7.9% |
| Native Hawaiians | 100.0 /100 | #34 | Exceptional 7.9% |
| Immigrants | South Central Asia | 100.0 /100 | #35 | Exceptional 7.9% |
| Burmese | 100.0 /100 | #36 | Exceptional 8.0% |
| Asians | 100.0 /100 | #37 | Exceptional 8.0% |