Choctaw vs Guamanian/Chamorro In Labor Force | Age 25-29
COMPARE
Choctaw
Guamanian/Chamorro
In Labor Force | Age 25-29
In Labor Force | Age 25-29 Comparison
Choctaw
Guamanians/Chamorros
81.0%
IN LABOR FORCE | AGE 25-29
0.0/ 100
METRIC RATING
326th/ 347
METRIC RANK
83.9%
IN LABOR FORCE | AGE 25-29
0.9/ 100
METRIC RATING
236th/ 347
METRIC RANK
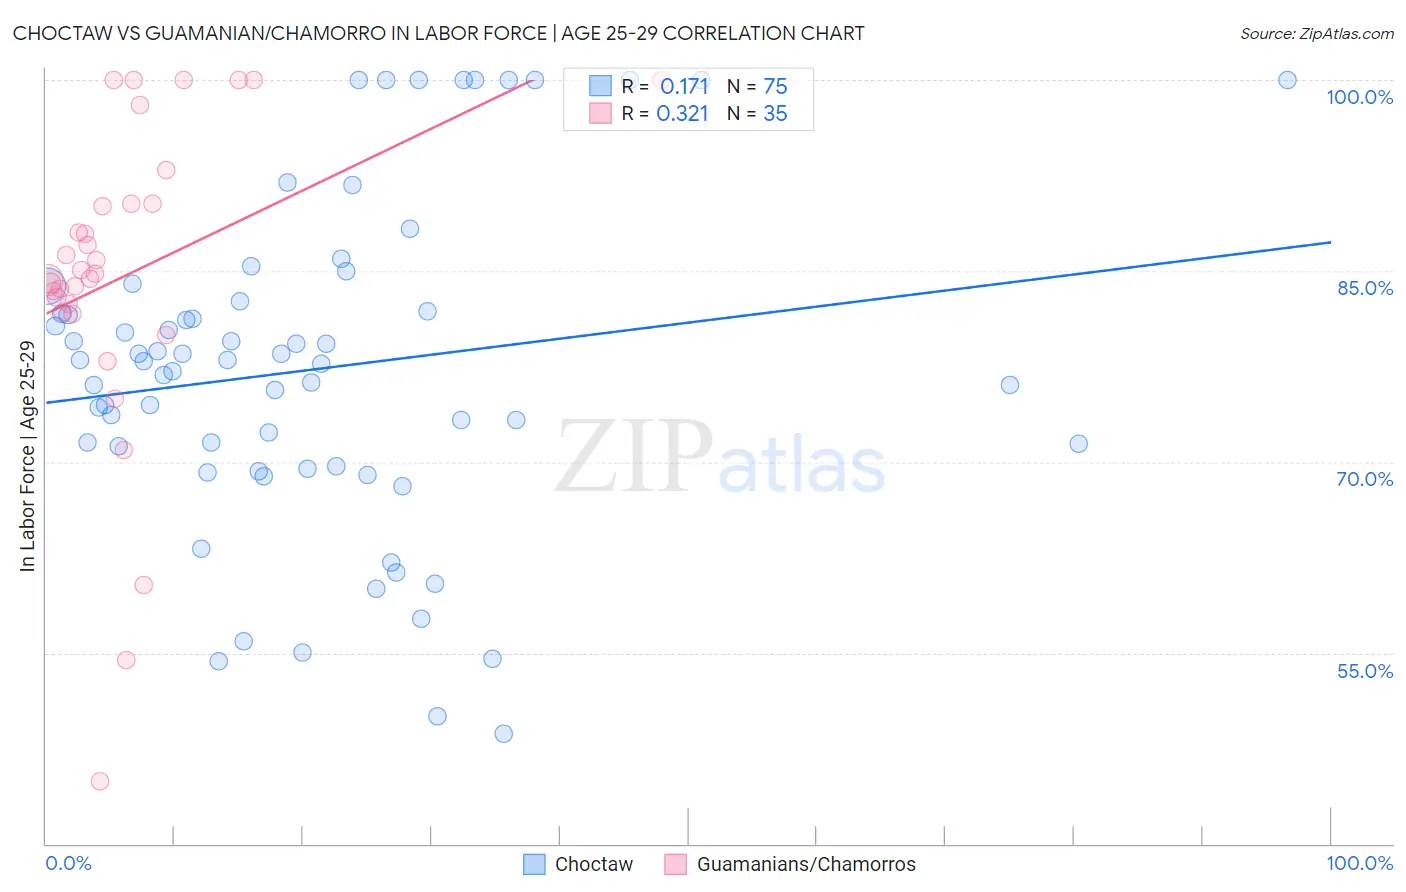
Choctaw vs Guamanian/Chamorro In Labor Force | Age 25-29 Correlation Chart
The statistical analysis conducted on geographies consisting of 269,623,280 people shows a poor positive correlation between the proportion of Choctaw and labor force participation rate among population between the ages 25 and 29 in the United States with a correlation coefficient (R) of 0.171 and weighted average of 81.0%. Similarly, the statistical analysis conducted on geographies consisting of 221,933,719 people shows a mild positive correlation between the proportion of Guamanians/Chamorros and labor force participation rate among population between the ages 25 and 29 in the United States with a correlation coefficient (R) of 0.321 and weighted average of 83.9%, a difference of 3.6%.
In Labor Force | Age 25-29 Correlation Summary
| Measurement | Choctaw | Guamanian/Chamorro |
| Minimum | 48.6% | 44.9% |
| Maximum | 100.0% | 100.0% |
| Range | 51.4% | 55.1% |
| Mean | 77.3% | 84.6% |
| Median | 77.9% | 84.8% |
| Interquartile 25% (IQ1) | 69.7% | 81.8% |
| Interquartile 75% (IQ3) | 82.6% | 90.3% |
| Interquartile Range (IQR) | 12.9% | 8.6% |
| Standard Deviation (Sample) | 12.8% | 12.4% |
| Standard Deviation (Population) | 12.7% | 12.3% |
Similar Demographics by In Labor Force | Age 25-29
Demographics Similar to Choctaw by In Labor Force | Age 25-29
In terms of in labor force | age 25-29, the demographic groups most similar to Choctaw are Dutch West Indian (81.1%, a difference of 0.20%), Ute (80.8%, a difference of 0.20%), Houma (81.2%, a difference of 0.32%), Creek (80.7%, a difference of 0.35%), and Yakama (80.6%, a difference of 0.46%).
| Demographics | Rating | Rank | In Labor Force | Age 25-29 |
| Seminole | 0.0 /100 | #319 | Tragic 81.7% |
| Colville | 0.0 /100 | #320 | Tragic 81.6% |
| Shoshone | 0.0 /100 | #321 | Tragic 81.6% |
| Kiowa | 0.0 /100 | #322 | Tragic 81.6% |
| Alaska Natives | 0.0 /100 | #323 | Tragic 81.6% |
| Houma | 0.0 /100 | #324 | Tragic 81.2% |
| Dutch West Indians | 0.0 /100 | #325 | Tragic 81.1% |
| Choctaw | 0.0 /100 | #326 | Tragic 81.0% |
| Ute | 0.0 /100 | #327 | Tragic 80.8% |
| Creek | 0.0 /100 | #328 | Tragic 80.7% |
| Yakama | 0.0 /100 | #329 | Tragic 80.6% |
| Puerto Ricans | 0.0 /100 | #330 | Tragic 80.4% |
| Cheyenne | 0.0 /100 | #331 | Tragic 80.3% |
| Inupiat | 0.0 /100 | #332 | Tragic 79.8% |
| Sioux | 0.0 /100 | #333 | Tragic 79.7% |
Demographics Similar to Guamanians/Chamorros by In Labor Force | Age 25-29
In terms of in labor force | age 25-29, the demographic groups most similar to Guamanians/Chamorros are Iraqi (83.9%, a difference of 0.0%), Immigrants (83.9%, a difference of 0.0%), Barbadian (83.9%, a difference of 0.020%), Immigrants from Uzbekistan (83.9%, a difference of 0.030%), and Jamaican (83.9%, a difference of 0.040%).
| Demographics | Rating | Rank | In Labor Force | Age 25-29 |
| Immigrants | Oceania | 5.0 /100 | #229 | Tragic 84.2% |
| Whites/Caucasians | 4.8 /100 | #230 | Tragic 84.2% |
| Immigrants | Philippines | 4.7 /100 | #231 | Tragic 84.2% |
| Panamanians | 4.5 /100 | #232 | Tragic 84.2% |
| Immigrants | Western Asia | 2.7 /100 | #233 | Tragic 84.1% |
| Barbadians | 1.0 /100 | #234 | Tragic 83.9% |
| Iraqis | 0.9 /100 | #235 | Tragic 83.9% |
| Guamanians/Chamorros | 0.9 /100 | #236 | Tragic 83.9% |
| Immigrants | Immigrants | 0.9 /100 | #237 | Tragic 83.9% |
| Immigrants | Uzbekistan | 0.8 /100 | #238 | Tragic 83.9% |
| Jamaicans | 0.8 /100 | #239 | Tragic 83.9% |
| Trinidadians and Tobagonians | 0.7 /100 | #240 | Tragic 83.9% |
| Alsatians | 0.7 /100 | #241 | Tragic 83.9% |
| U.S. Virgin Islanders | 0.6 /100 | #242 | Tragic 83.8% |
| Salvadorans | 0.5 /100 | #243 | Tragic 83.8% |