Immigrants from Fiji vs Immigrants from Iran In Labor Force | Age 25-29
COMPARE
Immigrants from Fiji
Immigrants from Iran
In Labor Force | Age 25-29
In Labor Force | Age 25-29 Comparison
Immigrants from Fiji
Immigrants from Iran
83.6%
IN LABOR FORCE | AGE 25-29
0.1/ 100
METRIC RATING
262nd/ 347
METRIC RANK
84.9%
IN LABOR FORCE | AGE 25-29
84.8/ 100
METRIC RATING
124th/ 347
METRIC RANK
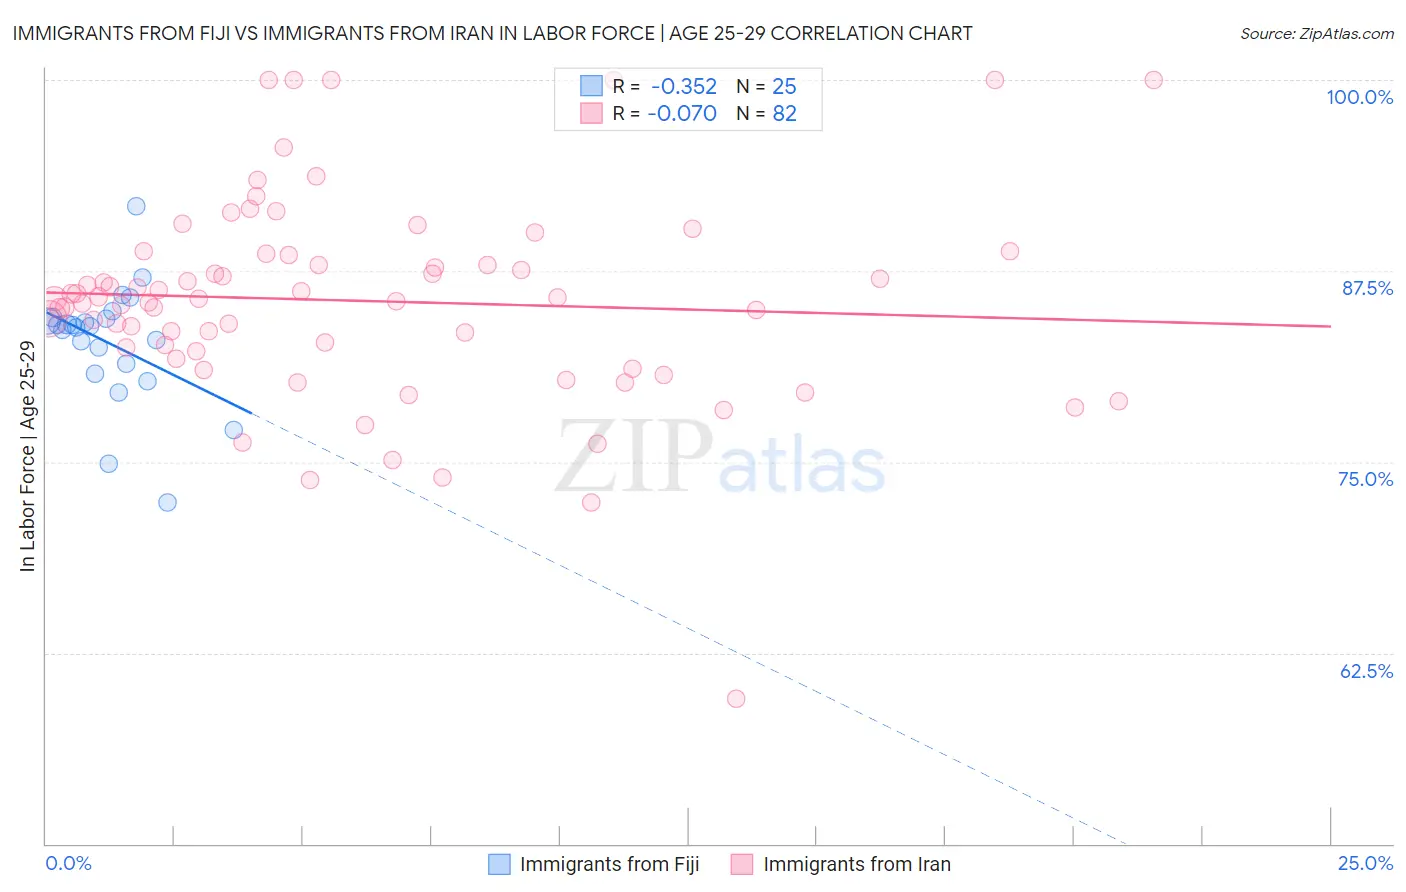
Immigrants from Fiji vs Immigrants from Iran In Labor Force | Age 25-29 Correlation Chart
The statistical analysis conducted on geographies consisting of 93,752,229 people shows a mild negative correlation between the proportion of Immigrants from Fiji and labor force participation rate among population between the ages 25 and 29 in the United States with a correlation coefficient (R) of -0.352 and weighted average of 83.6%. Similarly, the statistical analysis conducted on geographies consisting of 279,858,438 people shows a slight negative correlation between the proportion of Immigrants from Iran and labor force participation rate among population between the ages 25 and 29 in the United States with a correlation coefficient (R) of -0.070 and weighted average of 84.9%, a difference of 1.6%.
In Labor Force | Age 25-29 Correlation Summary
| Measurement | Immigrants from Fiji | Immigrants from Iran |
| Minimum | 72.3% | 59.5% |
| Maximum | 91.7% | 100.0% |
| Range | 19.4% | 40.5% |
| Mean | 82.8% | 85.5% |
| Median | 83.9% | 85.7% |
| Interquartile 25% (IQ1) | 81.1% | 82.3% |
| Interquartile 75% (IQ3) | 84.4% | 88.6% |
| Interquartile Range (IQR) | 3.3% | 6.3% |
| Standard Deviation (Sample) | 3.9% | 6.8% |
| Standard Deviation (Population) | 3.8% | 6.7% |
Similar Demographics by In Labor Force | Age 25-29
Demographics Similar to Immigrants from Fiji by In Labor Force | Age 25-29
In terms of in labor force | age 25-29, the demographic groups most similar to Immigrants from Fiji are West Indian (83.5%, a difference of 0.040%), Pennsylvania German (83.6%, a difference of 0.060%), Immigrants from Bahamas (83.6%, a difference of 0.070%), Immigrants from Guatemala (83.6%, a difference of 0.080%), and Spanish (83.6%, a difference of 0.080%).
| Demographics | Rating | Rank | In Labor Force | Age 25-29 |
| Haitians | 0.2 /100 | #255 | Tragic 83.7% |
| Immigrants | Haiti | 0.2 /100 | #256 | Tragic 83.7% |
| Delaware | 0.2 /100 | #257 | Tragic 83.7% |
| Immigrants | Guatemala | 0.1 /100 | #258 | Tragic 83.6% |
| Spanish | 0.1 /100 | #259 | Tragic 83.6% |
| Immigrants | Bahamas | 0.1 /100 | #260 | Tragic 83.6% |
| Pennsylvania Germans | 0.1 /100 | #261 | Tragic 83.6% |
| Immigrants | Fiji | 0.1 /100 | #262 | Tragic 83.6% |
| West Indians | 0.1 /100 | #263 | Tragic 83.5% |
| Puget Sound Salish | 0.1 /100 | #264 | Tragic 83.5% |
| Cubans | 0.1 /100 | #265 | Tragic 83.5% |
| Aleuts | 0.0 /100 | #266 | Tragic 83.4% |
| Spanish Americans | 0.0 /100 | #267 | Tragic 83.4% |
| Immigrants | Lebanon | 0.0 /100 | #268 | Tragic 83.4% |
| Immigrants | Barbados | 0.0 /100 | #269 | Tragic 83.4% |
Demographics Similar to Immigrants from Iran by In Labor Force | Age 25-29
In terms of in labor force | age 25-29, the demographic groups most similar to Immigrants from Iran are Scandinavian (84.9%, a difference of 0.0%), Dutch (84.9%, a difference of 0.0%), Uruguayan (84.9%, a difference of 0.0%), Immigrants from Chile (84.9%, a difference of 0.010%), and Immigrants from Singapore (84.9%, a difference of 0.010%).
| Demographics | Rating | Rank | In Labor Force | Age 25-29 |
| Immigrants | Belarus | 88.0 /100 | #117 | Excellent 85.0% |
| Finns | 87.8 /100 | #118 | Excellent 85.0% |
| Filipinos | 87.1 /100 | #119 | Excellent 84.9% |
| Immigrants | South Africa | 86.1 /100 | #120 | Excellent 84.9% |
| Immigrants | Chile | 85.6 /100 | #121 | Excellent 84.9% |
| Scandinavians | 85.1 /100 | #122 | Excellent 84.9% |
| Dutch | 84.9 /100 | #123 | Excellent 84.9% |
| Immigrants | Iran | 84.8 /100 | #124 | Excellent 84.9% |
| Uruguayans | 84.7 /100 | #125 | Excellent 84.9% |
| Immigrants | Singapore | 84.4 /100 | #126 | Excellent 84.9% |
| Immigrants | Uruguay | 84.0 /100 | #127 | Excellent 84.9% |
| Australians | 83.6 /100 | #128 | Excellent 84.9% |
| Immigrants | Russia | 81.6 /100 | #129 | Excellent 84.9% |
| Northern Europeans | 81.3 /100 | #130 | Excellent 84.9% |
| Iranians | 78.1 /100 | #131 | Good 84.8% |