Choctaw vs Immigrants from Iran In Labor Force | Age 16-19
COMPARE
Choctaw
Immigrants from Iran
In Labor Force | Age 16-19
In Labor Force | Age 16-19 Comparison
Choctaw
Immigrants from Iran
38.0%
IN LABOR FORCE | AGE 16-19
95.6/ 100
METRIC RATING
127th/ 347
METRIC RANK
32.0%
IN LABOR FORCE | AGE 16-19
0.0/ 100
METRIC RATING
310th/ 347
METRIC RANK
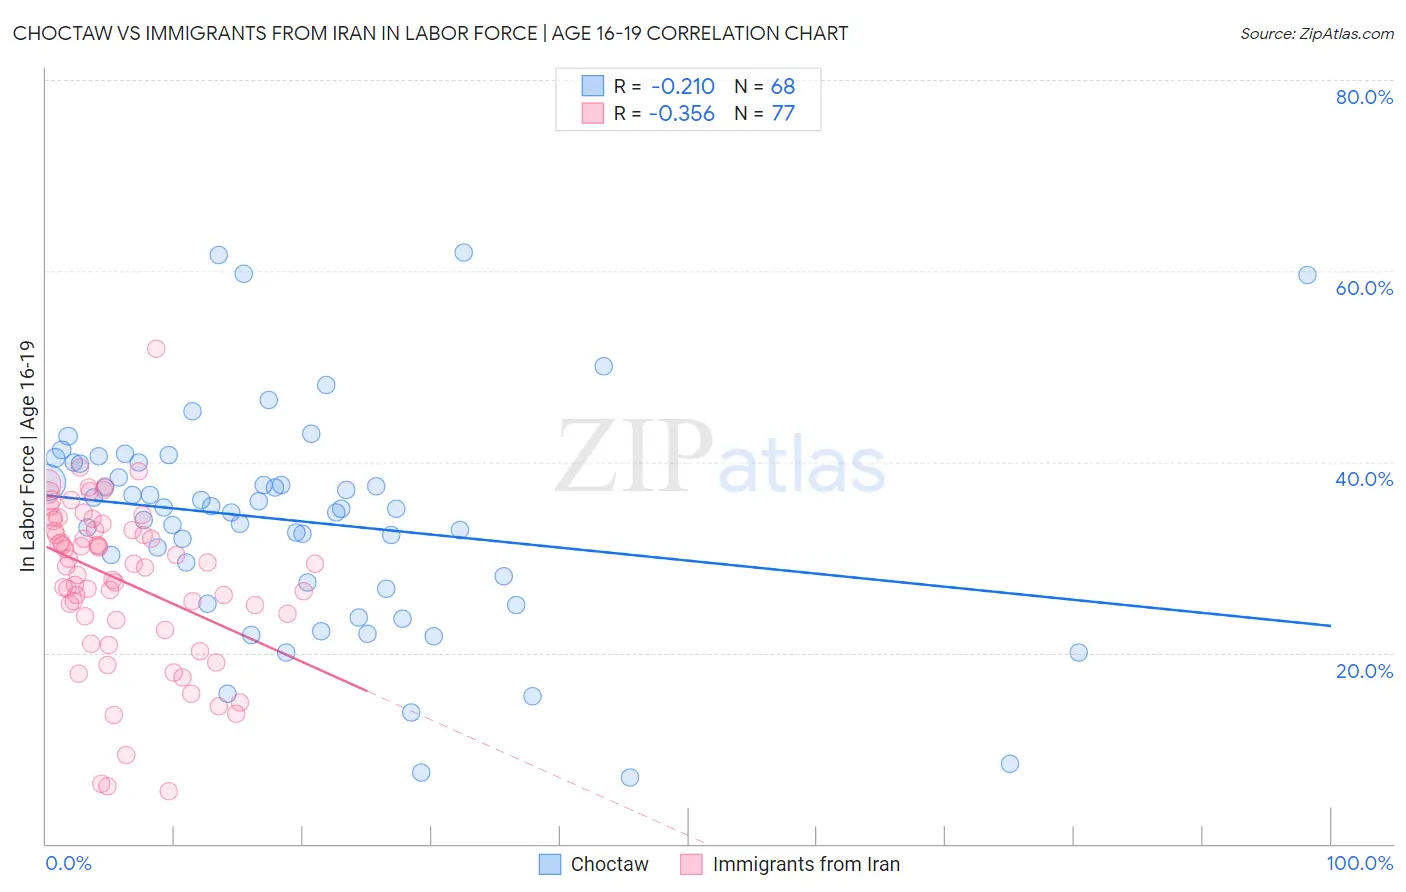
Choctaw vs Immigrants from Iran In Labor Force | Age 16-19 Correlation Chart
The statistical analysis conducted on geographies consisting of 269,371,385 people shows a weak negative correlation between the proportion of Choctaw and labor force participation rate among population between the ages 16 and 19 in the United States with a correlation coefficient (R) of -0.210 and weighted average of 38.0%. Similarly, the statistical analysis conducted on geographies consisting of 279,510,486 people shows a mild negative correlation between the proportion of Immigrants from Iran and labor force participation rate among population between the ages 16 and 19 in the United States with a correlation coefficient (R) of -0.356 and weighted average of 32.0%, a difference of 18.8%.
In Labor Force | Age 16-19 Correlation Summary
| Measurement | Choctaw | Immigrants from Iran |
| Minimum | 6.9% | 5.5% |
| Maximum | 61.9% | 51.8% |
| Range | 55.0% | 46.3% |
| Mean | 33.8% | 27.6% |
| Median | 35.1% | 29.3% |
| Interquartile 25% (IQ1) | 27.0% | 23.6% |
| Interquartile 75% (IQ3) | 39.9% | 33.2% |
| Interquartile Range (IQR) | 12.8% | 9.6% |
| Standard Deviation (Sample) | 11.5% | 8.5% |
| Standard Deviation (Population) | 11.5% | 8.5% |
Similar Demographics by In Labor Force | Age 16-19
Demographics Similar to Choctaw by In Labor Force | Age 16-19
In terms of in labor force | age 16-19, the demographic groups most similar to Choctaw are New Zealander (38.0%, a difference of 0.0%), African (38.0%, a difference of 0.010%), Spaniard (38.0%, a difference of 0.030%), Immigrants from Zimbabwe (38.0%, a difference of 0.060%), and Immigrants from Austria (37.9%, a difference of 0.15%).
| Demographics | Rating | Rank | In Labor Force | Age 16-19 |
| Ukrainians | 97.6 /100 | #120 | Exceptional 38.3% |
| Ethiopians | 97.4 /100 | #121 | Exceptional 38.2% |
| Guamanians/Chamorros | 97.4 /100 | #122 | Exceptional 38.2% |
| Seminole | 96.7 /100 | #123 | Exceptional 38.1% |
| Immigrants | England | 96.4 /100 | #124 | Exceptional 38.1% |
| Immigrants | Africa | 96.1 /100 | #125 | Exceptional 38.0% |
| Africans | 95.6 /100 | #126 | Exceptional 38.0% |
| Choctaw | 95.6 /100 | #127 | Exceptional 38.0% |
| New Zealanders | 95.6 /100 | #128 | Exceptional 38.0% |
| Spaniards | 95.5 /100 | #129 | Exceptional 38.0% |
| Immigrants | Zimbabwe | 95.4 /100 | #130 | Exceptional 38.0% |
| Immigrants | Austria | 95.0 /100 | #131 | Exceptional 37.9% |
| Immigrants | Oceania | 94.7 /100 | #132 | Exceptional 37.9% |
| Cheyenne | 94.6 /100 | #133 | Exceptional 37.9% |
| Immigrants | Netherlands | 93.7 /100 | #134 | Exceptional 37.8% |
Demographics Similar to Immigrants from Iran by In Labor Force | Age 16-19
In terms of in labor force | age 16-19, the demographic groups most similar to Immigrants from Iran are Immigrants from Eastern Asia (32.0%, a difference of 0.14%), Navajo (32.1%, a difference of 0.32%), Indian (Asian) (31.9%, a difference of 0.37%), Immigrants from Belize (31.8%, a difference of 0.51%), and Hopi (31.8%, a difference of 0.51%).
| Demographics | Rating | Rank | In Labor Force | Age 16-19 |
| Immigrants | Dominica | 0.0 /100 | #303 | Tragic 32.5% |
| Israelis | 0.0 /100 | #304 | Tragic 32.4% |
| Nicaraguans | 0.0 /100 | #305 | Tragic 32.4% |
| Spanish American Indians | 0.0 /100 | #306 | Tragic 32.4% |
| Immigrants | Jamaica | 0.0 /100 | #307 | Tragic 32.2% |
| Navajo | 0.0 /100 | #308 | Tragic 32.1% |
| Immigrants | Eastern Asia | 0.0 /100 | #309 | Tragic 32.0% |
| Immigrants | Iran | 0.0 /100 | #310 | Tragic 32.0% |
| Indians (Asian) | 0.0 /100 | #311 | Tragic 31.9% |
| Immigrants | Belize | 0.0 /100 | #312 | Tragic 31.8% |
| Hopi | 0.0 /100 | #313 | Tragic 31.8% |
| Cubans | 0.0 /100 | #314 | Tragic 31.8% |
| Immigrants | West Indies | 0.0 /100 | #315 | Tragic 31.7% |
| Filipinos | 0.0 /100 | #316 | Tragic 31.7% |
| Immigrants | Nicaragua | 0.0 /100 | #317 | Tragic 31.6% |