Choctaw vs Immigrants from Barbados In Labor Force | Age 35-44
COMPARE
Choctaw
Immigrants from Barbados
In Labor Force | Age 35-44
In Labor Force | Age 35-44 Comparison
Choctaw
Immigrants from Barbados
80.5%
IN LABOR FORCE | AGE 35-44
0.0/ 100
METRIC RATING
324th/ 347
METRIC RANK
84.1%
IN LABOR FORCE | AGE 35-44
13.2/ 100
METRIC RATING
214th/ 347
METRIC RANK
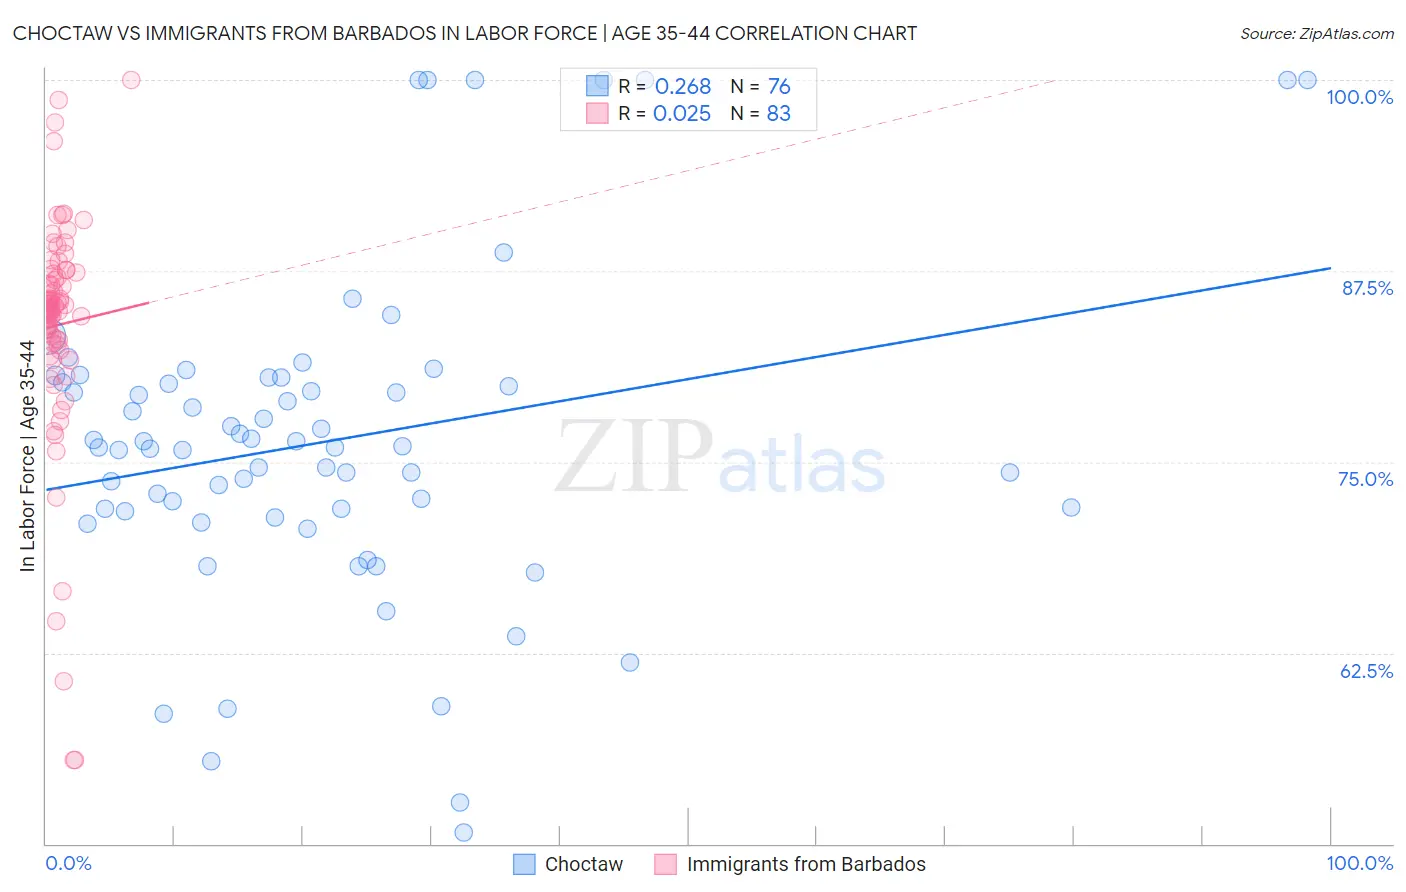
Choctaw vs Immigrants from Barbados In Labor Force | Age 35-44 Correlation Chart
The statistical analysis conducted on geographies consisting of 269,650,989 people shows a weak positive correlation between the proportion of Choctaw and labor force participation rate among population between the ages 35 and 44 in the United States with a correlation coefficient (R) of 0.268 and weighted average of 80.5%. Similarly, the statistical analysis conducted on geographies consisting of 112,764,413 people shows no correlation between the proportion of Immigrants from Barbados and labor force participation rate among population between the ages 35 and 44 in the United States with a correlation coefficient (R) of 0.025 and weighted average of 84.1%, a difference of 4.4%.
In Labor Force | Age 35-44 Correlation Summary
| Measurement | Choctaw | Immigrants from Barbados |
| Minimum | 50.8% | 55.5% |
| Maximum | 100.0% | 100.0% |
| Range | 49.2% | 44.5% |
| Mean | 76.4% | 84.0% |
| Median | 76.0% | 85.1% |
| Interquartile 25% (IQ1) | 71.8% | 82.8% |
| Interquartile 75% (IQ3) | 80.4% | 87.3% |
| Interquartile Range (IQR) | 8.5% | 4.5% |
| Standard Deviation (Sample) | 10.5% | 7.5% |
| Standard Deviation (Population) | 10.4% | 7.5% |
Similar Demographics by In Labor Force | Age 35-44
Demographics Similar to Choctaw by In Labor Force | Age 35-44
In terms of in labor force | age 35-44, the demographic groups most similar to Choctaw are Yaqui (80.5%, a difference of 0.010%), Paiute (80.6%, a difference of 0.13%), Dutch West Indian (80.4%, a difference of 0.15%), Puerto Rican (80.7%, a difference of 0.19%), and Seminole (80.4%, a difference of 0.19%).
| Demographics | Rating | Rank | In Labor Force | Age 35-44 |
| Cherokee | 0.0 /100 | #317 | Tragic 81.4% |
| Alaskan Athabascans | 0.0 /100 | #318 | Tragic 81.3% |
| Inupiat | 0.0 /100 | #319 | Tragic 80.9% |
| Chickasaw | 0.0 /100 | #320 | Tragic 80.9% |
| Puerto Ricans | 0.0 /100 | #321 | Tragic 80.7% |
| Paiute | 0.0 /100 | #322 | Tragic 80.6% |
| Yaqui | 0.0 /100 | #323 | Tragic 80.5% |
| Choctaw | 0.0 /100 | #324 | Tragic 80.5% |
| Dutch West Indians | 0.0 /100 | #325 | Tragic 80.4% |
| Seminole | 0.0 /100 | #326 | Tragic 80.4% |
| Sioux | 0.0 /100 | #327 | Tragic 80.2% |
| Creek | 0.0 /100 | #328 | Tragic 80.0% |
| Menominee | 0.0 /100 | #329 | Tragic 79.7% |
| Cheyenne | 0.0 /100 | #330 | Tragic 79.5% |
| Houma | 0.0 /100 | #331 | Tragic 79.5% |
Demographics Similar to Immigrants from Barbados by In Labor Force | Age 35-44
In terms of in labor force | age 35-44, the demographic groups most similar to Immigrants from Barbados are Israeli (84.1%, a difference of 0.010%), Bangladeshi (84.1%, a difference of 0.010%), European (84.1%, a difference of 0.010%), Nicaraguan (84.1%, a difference of 0.020%), and Immigrants from Norway (84.1%, a difference of 0.020%).
| Demographics | Rating | Rank | In Labor Force | Age 35-44 |
| Laotians | 19.0 /100 | #207 | Poor 84.2% |
| Immigrants | North America | 18.1 /100 | #208 | Poor 84.2% |
| Swiss | 17.4 /100 | #209 | Poor 84.2% |
| New Zealanders | 16.2 /100 | #210 | Poor 84.1% |
| Immigrants | Ecuador | 15.2 /100 | #211 | Poor 84.1% |
| Israelis | 14.0 /100 | #212 | Poor 84.1% |
| Bangladeshis | 13.7 /100 | #213 | Poor 84.1% |
| Immigrants | Barbados | 13.2 /100 | #214 | Poor 84.1% |
| Europeans | 12.2 /100 | #215 | Poor 84.1% |
| Nicaraguans | 12.1 /100 | #216 | Poor 84.1% |
| Immigrants | Norway | 11.7 /100 | #217 | Poor 84.1% |
| Immigrants | Nicaragua | 9.4 /100 | #218 | Tragic 84.1% |
| Sub-Saharan Africans | 9.3 /100 | #219 | Tragic 84.1% |
| French | 7.5 /100 | #220 | Tragic 84.0% |
| Icelanders | 6.7 /100 | #221 | Tragic 84.0% |