Immigrants from Moldova vs Immigrants from Barbados In Labor Force | Age 35-44
COMPARE
Immigrants from Moldova
Immigrants from Barbados
In Labor Force | Age 35-44
In Labor Force | Age 35-44 Comparison
Immigrants from Moldova
Immigrants from Barbados
85.0%
IN LABOR FORCE | AGE 35-44
99.3/ 100
METRIC RATING
62nd/ 347
METRIC RANK
84.1%
IN LABOR FORCE | AGE 35-44
13.2/ 100
METRIC RATING
214th/ 347
METRIC RANK
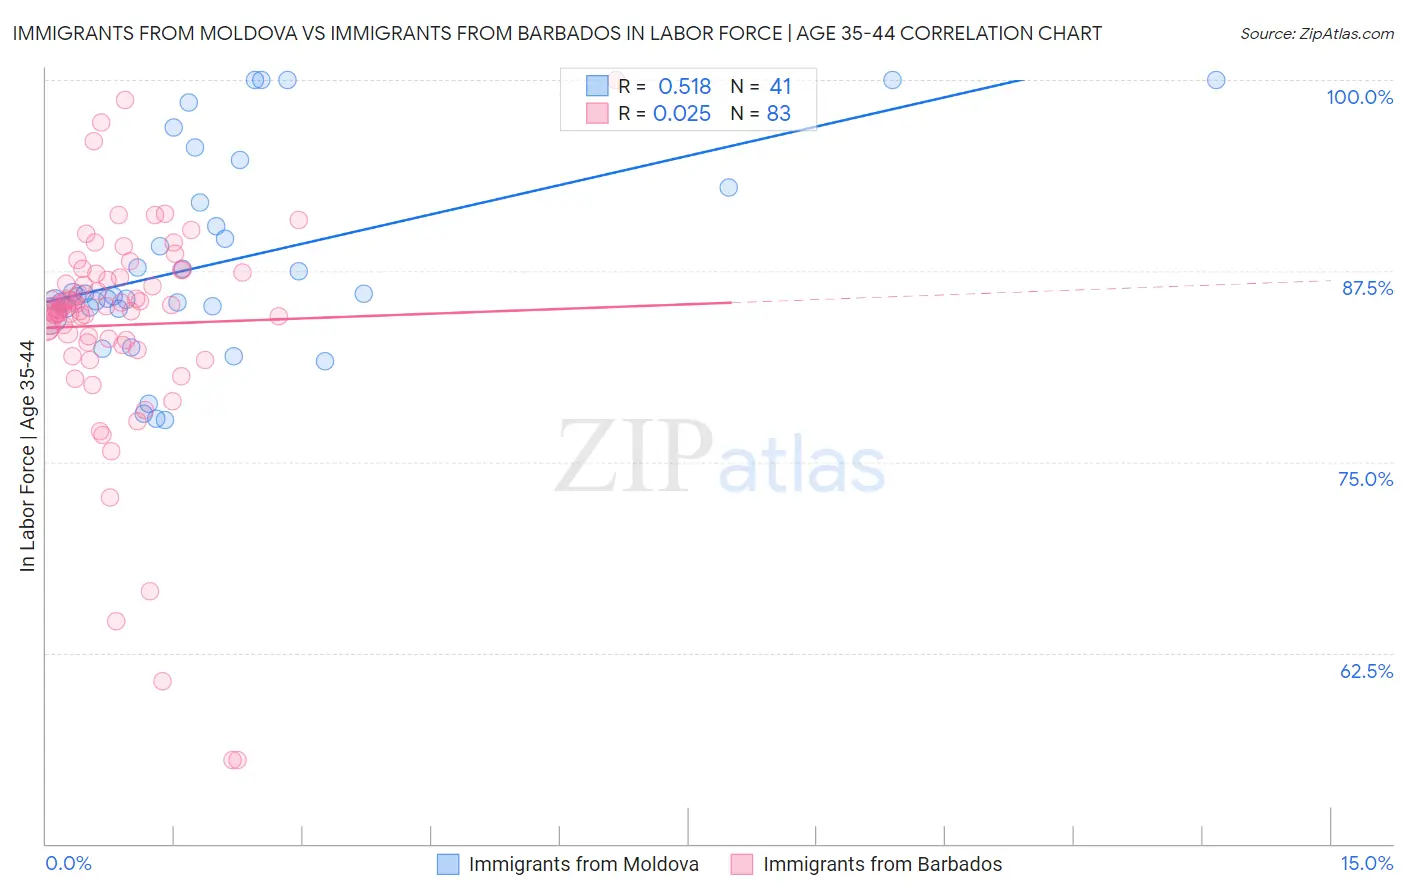
Immigrants from Moldova vs Immigrants from Barbados In Labor Force | Age 35-44 Correlation Chart
The statistical analysis conducted on geographies consisting of 124,382,028 people shows a substantial positive correlation between the proportion of Immigrants from Moldova and labor force participation rate among population between the ages 35 and 44 in the United States with a correlation coefficient (R) of 0.518 and weighted average of 85.0%. Similarly, the statistical analysis conducted on geographies consisting of 112,764,413 people shows no correlation between the proportion of Immigrants from Barbados and labor force participation rate among population between the ages 35 and 44 in the United States with a correlation coefficient (R) of 0.025 and weighted average of 84.1%, a difference of 1.1%.
In Labor Force | Age 35-44 Correlation Summary
| Measurement | Immigrants from Moldova | Immigrants from Barbados |
| Minimum | 77.8% | 55.5% |
| Maximum | 100.0% | 100.0% |
| Range | 22.2% | 44.5% |
| Mean | 88.1% | 84.0% |
| Median | 85.8% | 85.1% |
| Interquartile 25% (IQ1) | 85.1% | 82.8% |
| Interquartile 75% (IQ3) | 92.5% | 87.3% |
| Interquartile Range (IQR) | 7.4% | 4.5% |
| Standard Deviation (Sample) | 6.5% | 7.5% |
| Standard Deviation (Population) | 6.4% | 7.5% |
Similar Demographics by In Labor Force | Age 35-44
Demographics Similar to Immigrants from Moldova by In Labor Force | Age 35-44
In terms of in labor force | age 35-44, the demographic groups most similar to Immigrants from Moldova are Immigrants from Uganda (85.0%, a difference of 0.0%), Immigrants from Latvia (85.0%, a difference of 0.010%), Swedish (85.0%, a difference of 0.010%), Albanian (85.1%, a difference of 0.020%), and Immigrants from Brazil (85.0%, a difference of 0.020%).
| Demographics | Rating | Rank | In Labor Force | Age 35-44 |
| Soviet Union | 99.5 /100 | #55 | Exceptional 85.1% |
| Immigrants | Croatia | 99.5 /100 | #56 | Exceptional 85.1% |
| Chinese | 99.4 /100 | #57 | Exceptional 85.1% |
| Slovaks | 99.4 /100 | #58 | Exceptional 85.1% |
| Serbians | 99.4 /100 | #59 | Exceptional 85.1% |
| Albanians | 99.4 /100 | #60 | Exceptional 85.1% |
| Immigrants | Latvia | 99.3 /100 | #61 | Exceptional 85.0% |
| Immigrants | Moldova | 99.3 /100 | #62 | Exceptional 85.0% |
| Immigrants | Uganda | 99.3 /100 | #63 | Exceptional 85.0% |
| Swedes | 99.2 /100 | #64 | Exceptional 85.0% |
| Immigrants | Brazil | 99.2 /100 | #65 | Exceptional 85.0% |
| Immigrants | Haiti | 99.1 /100 | #66 | Exceptional 85.0% |
| Immigrants | Italy | 99.1 /100 | #67 | Exceptional 85.0% |
| Italians | 99.1 /100 | #68 | Exceptional 85.0% |
| Sudanese | 99.0 /100 | #69 | Exceptional 85.0% |
Demographics Similar to Immigrants from Barbados by In Labor Force | Age 35-44
In terms of in labor force | age 35-44, the demographic groups most similar to Immigrants from Barbados are Israeli (84.1%, a difference of 0.010%), Bangladeshi (84.1%, a difference of 0.010%), European (84.1%, a difference of 0.010%), Nicaraguan (84.1%, a difference of 0.020%), and Immigrants from Norway (84.1%, a difference of 0.020%).
| Demographics | Rating | Rank | In Labor Force | Age 35-44 |
| Laotians | 19.0 /100 | #207 | Poor 84.2% |
| Immigrants | North America | 18.1 /100 | #208 | Poor 84.2% |
| Swiss | 17.4 /100 | #209 | Poor 84.2% |
| New Zealanders | 16.2 /100 | #210 | Poor 84.1% |
| Immigrants | Ecuador | 15.2 /100 | #211 | Poor 84.1% |
| Israelis | 14.0 /100 | #212 | Poor 84.1% |
| Bangladeshis | 13.7 /100 | #213 | Poor 84.1% |
| Immigrants | Barbados | 13.2 /100 | #214 | Poor 84.1% |
| Europeans | 12.2 /100 | #215 | Poor 84.1% |
| Nicaraguans | 12.1 /100 | #216 | Poor 84.1% |
| Immigrants | Norway | 11.7 /100 | #217 | Poor 84.1% |
| Immigrants | Nicaragua | 9.4 /100 | #218 | Tragic 84.1% |
| Sub-Saharan Africans | 9.3 /100 | #219 | Tragic 84.1% |
| French | 7.5 /100 | #220 | Tragic 84.0% |
| Icelanders | 6.7 /100 | #221 | Tragic 84.0% |