Choctaw vs Immigrants from Barbados 7th Grade
COMPARE
Choctaw
Immigrants from Barbados
7th Grade
7th Grade Comparison
Choctaw
Immigrants from Barbados
96.5%
7TH GRADE
96.6/ 100
METRIC RATING
115th/ 347
METRIC RANK
95.0%
7TH GRADE
0.1/ 100
METRIC RATING
283rd/ 347
METRIC RANK
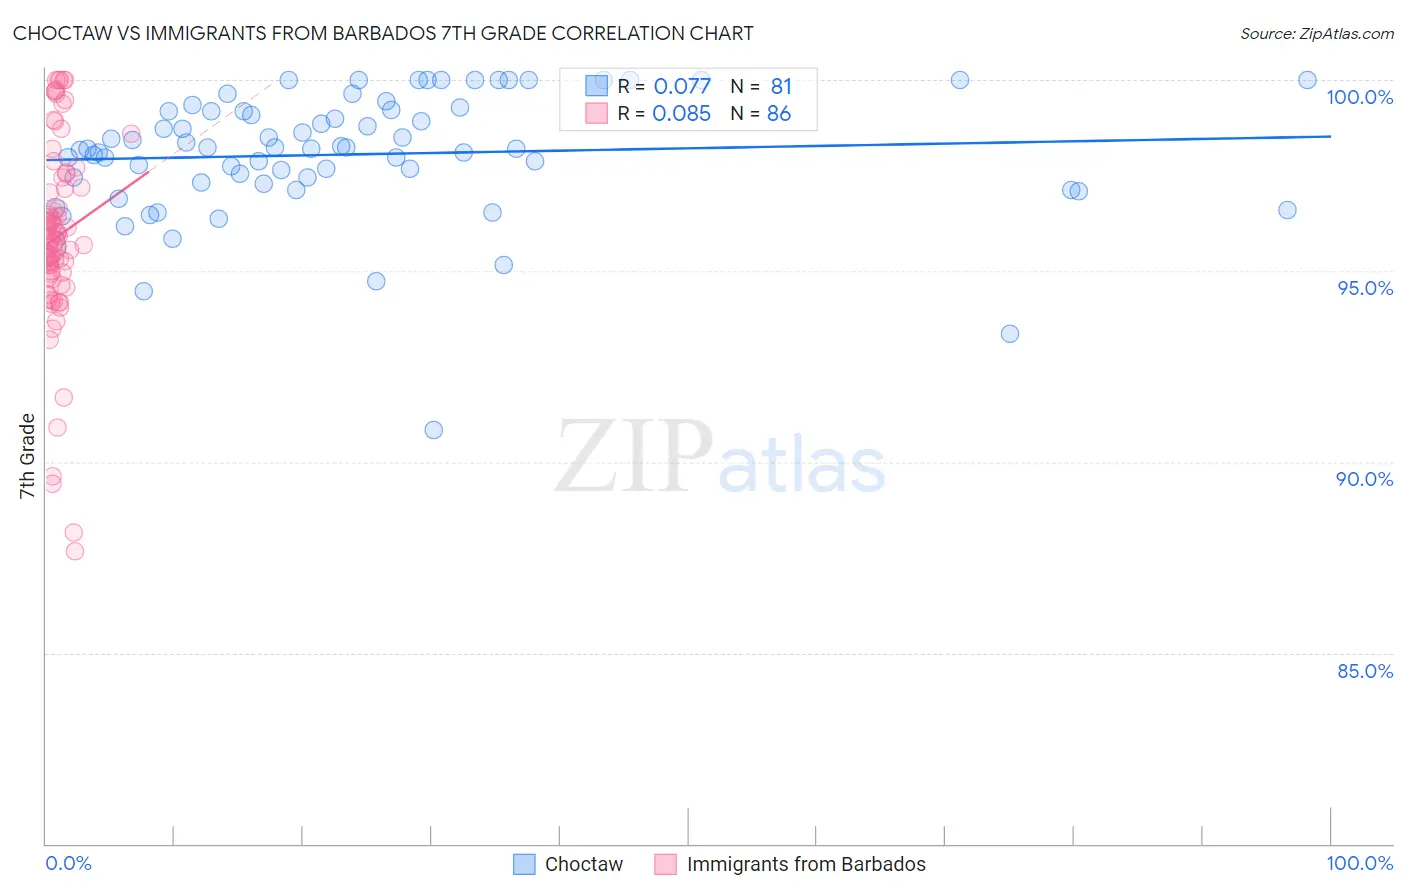
Choctaw vs Immigrants from Barbados 7th Grade Correlation Chart
The statistical analysis conducted on geographies consisting of 269,742,875 people shows a slight positive correlation between the proportion of Choctaw and percentage of population with at least 7th grade education in the United States with a correlation coefficient (R) of 0.077 and weighted average of 96.5%. Similarly, the statistical analysis conducted on geographies consisting of 112,787,165 people shows a slight positive correlation between the proportion of Immigrants from Barbados and percentage of population with at least 7th grade education in the United States with a correlation coefficient (R) of 0.085 and weighted average of 95.0%, a difference of 1.7%.
7th Grade Correlation Summary
| Measurement | Choctaw | Immigrants from Barbados |
| Minimum | 90.8% | 87.6% |
| Maximum | 100.0% | 100.0% |
| Range | 9.2% | 12.4% |
| Mean | 98.1% | 95.9% |
| Median | 98.2% | 95.8% |
| Interquartile 25% (IQ1) | 97.3% | 94.9% |
| Interquartile 75% (IQ3) | 99.2% | 97.2% |
| Interquartile Range (IQR) | 1.9% | 2.3% |
| Standard Deviation (Sample) | 1.7% | 2.5% |
| Standard Deviation (Population) | 1.6% | 2.5% |
Similar Demographics by 7th Grade
Demographics Similar to Choctaw by 7th Grade
In terms of 7th grade, the demographic groups most similar to Choctaw are Immigrants from Zimbabwe (96.5%, a difference of 0.0%), Syrian (96.5%, a difference of 0.0%), Pueblo (96.5%, a difference of 0.010%), Nonimmigrants (96.5%, a difference of 0.020%), and Okinawan (96.6%, a difference of 0.040%).
| Demographics | Rating | Rank | 7th Grade |
| Immigrants | Saudi Arabia | 97.8 /100 | #108 | Exceptional 96.6% |
| Bhutanese | 97.7 /100 | #109 | Exceptional 96.6% |
| Okinawans | 97.4 /100 | #110 | Exceptional 96.6% |
| Immigrants | Latvia | 97.4 /100 | #111 | Exceptional 96.6% |
| Immigrants | Nonimmigrants | 97.0 /100 | #112 | Exceptional 96.5% |
| Pueblo | 96.8 /100 | #113 | Exceptional 96.5% |
| Immigrants | Zimbabwe | 96.6 /100 | #114 | Exceptional 96.5% |
| Choctaw | 96.6 /100 | #115 | Exceptional 96.5% |
| Syrians | 96.6 /100 | #116 | Exceptional 96.5% |
| Immigrants | Moldova | 95.7 /100 | #117 | Exceptional 96.5% |
| Immigrants | Japan | 95.5 /100 | #118 | Exceptional 96.5% |
| Immigrants | Norway | 95.2 /100 | #119 | Exceptional 96.5% |
| Immigrants | Croatia | 95.0 /100 | #120 | Exceptional 96.5% |
| Cheyenne | 94.9 /100 | #121 | Exceptional 96.5% |
| Immigrants | Europe | 94.8 /100 | #122 | Exceptional 96.5% |
Demographics Similar to Immigrants from Barbados by 7th Grade
In terms of 7th grade, the demographic groups most similar to Immigrants from Barbados are Armenian (95.0%, a difference of 0.0%), Immigrants from Eritrea (94.9%, a difference of 0.010%), Immigrants from Bolivia (95.0%, a difference of 0.060%), Immigrants from St. Vincent and the Grenadines (95.0%, a difference of 0.070%), and Tohono O'odham (95.0%, a difference of 0.070%).
| Demographics | Rating | Rank | 7th Grade |
| Immigrants | Thailand | 0.2 /100 | #276 | Tragic 95.1% |
| Immigrants | Afghanistan | 0.2 /100 | #277 | Tragic 95.1% |
| Immigrants | Trinidad and Tobago | 0.1 /100 | #278 | Tragic 95.1% |
| Barbadians | 0.1 /100 | #279 | Tragic 95.1% |
| Immigrants | St. Vincent and the Grenadines | 0.1 /100 | #280 | Tragic 95.0% |
| Tohono O'odham | 0.1 /100 | #281 | Tragic 95.0% |
| Immigrants | Bolivia | 0.1 /100 | #282 | Tragic 95.0% |
| Immigrants | Barbados | 0.1 /100 | #283 | Tragic 95.0% |
| Armenians | 0.1 /100 | #284 | Tragic 95.0% |
| Immigrants | Eritrea | 0.1 /100 | #285 | Tragic 94.9% |
| Immigrants | Philippines | 0.0 /100 | #286 | Tragic 94.9% |
| Immigrants | Peru | 0.0 /100 | #287 | Tragic 94.9% |
| British West Indians | 0.0 /100 | #288 | Tragic 94.8% |
| Taiwanese | 0.0 /100 | #289 | Tragic 94.8% |
| Malaysians | 0.0 /100 | #290 | Tragic 94.8% |