Immigrants from Oceania vs Immigrants from Barbados In Labor Force | Age 35-44
COMPARE
Immigrants from Oceania
Immigrants from Barbados
In Labor Force | Age 35-44
In Labor Force | Age 35-44 Comparison
Immigrants from Oceania
Immigrants from Barbados
83.9%
IN LABOR FORCE | AGE 35-44
2.6/ 100
METRIC RATING
234th/ 347
METRIC RANK
84.1%
IN LABOR FORCE | AGE 35-44
13.2/ 100
METRIC RATING
214th/ 347
METRIC RANK
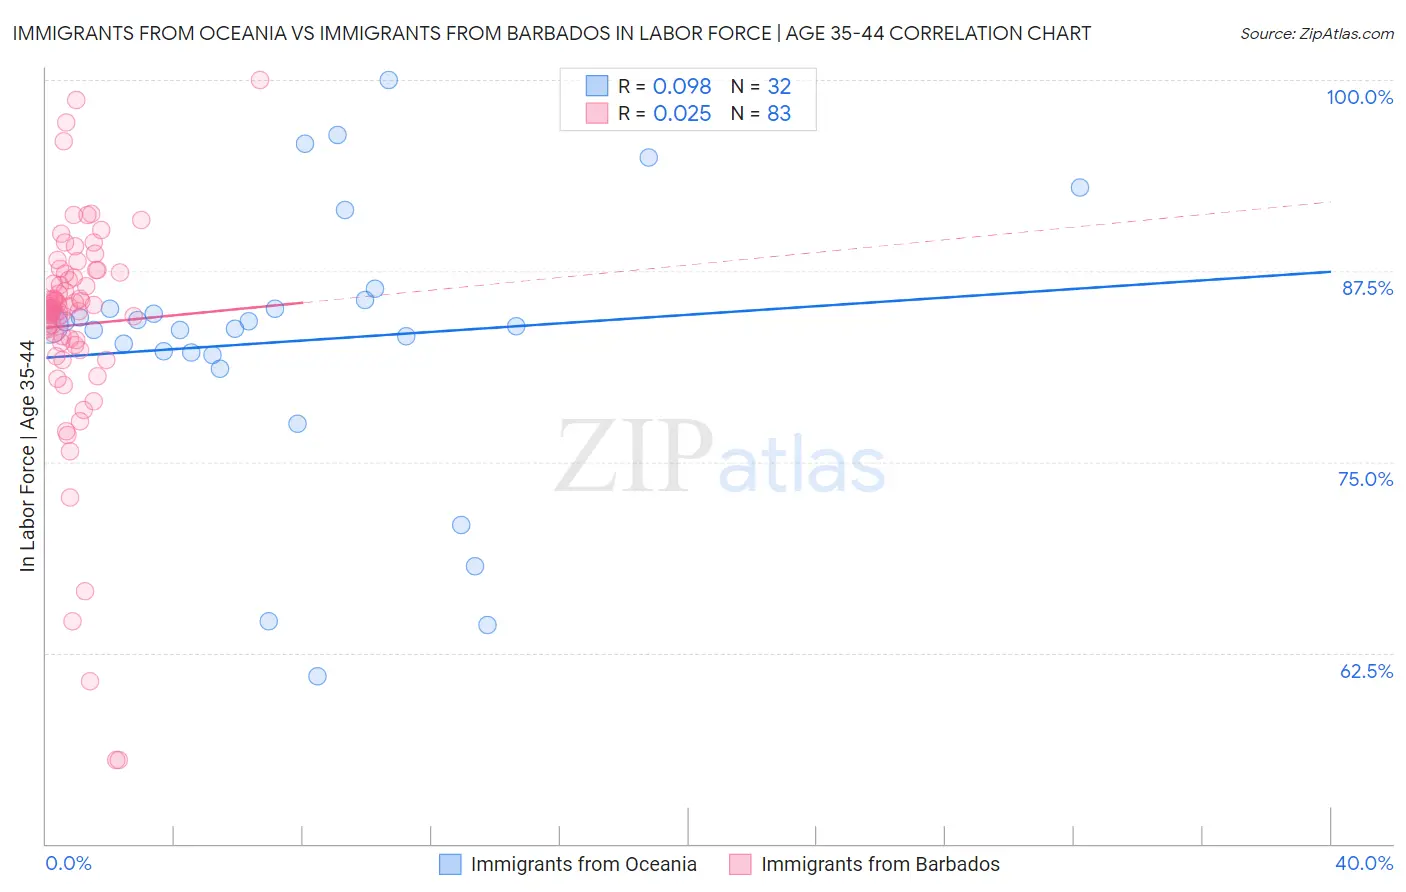
Immigrants from Oceania vs Immigrants from Barbados In Labor Force | Age 35-44 Correlation Chart
The statistical analysis conducted on geographies consisting of 305,435,378 people shows a slight positive correlation between the proportion of Immigrants from Oceania and labor force participation rate among population between the ages 35 and 44 in the United States with a correlation coefficient (R) of 0.098 and weighted average of 83.9%. Similarly, the statistical analysis conducted on geographies consisting of 112,764,413 people shows no correlation between the proportion of Immigrants from Barbados and labor force participation rate among population between the ages 35 and 44 in the United States with a correlation coefficient (R) of 0.025 and weighted average of 84.1%, a difference of 0.28%.
In Labor Force | Age 35-44 Correlation Summary
| Measurement | Immigrants from Oceania | Immigrants from Barbados |
| Minimum | 61.0% | 55.5% |
| Maximum | 100.0% | 100.0% |
| Range | 39.0% | 44.5% |
| Mean | 82.9% | 84.0% |
| Median | 83.9% | 85.1% |
| Interquartile 25% (IQ1) | 82.0% | 82.8% |
| Interquartile 75% (IQ3) | 85.3% | 87.3% |
| Interquartile Range (IQR) | 3.3% | 4.5% |
| Standard Deviation (Sample) | 9.1% | 7.5% |
| Standard Deviation (Population) | 9.0% | 7.5% |
Demographics Similar to Immigrants from Oceania and Immigrants from Barbados by In Labor Force | Age 35-44
In terms of in labor force | age 35-44, the demographic groups most similar to Immigrants from Oceania are Immigrants from Germany (83.9%, a difference of 0.010%), Native Hawaiian (83.9%, a difference of 0.020%), Scottish (83.9%, a difference of 0.030%), Immigrants from Iraq (83.9%, a difference of 0.060%), and Immigrants from Thailand (84.0%, a difference of 0.10%). Similarly, the demographic groups most similar to Immigrants from Barbados are European (84.1%, a difference of 0.010%), Nicaraguan (84.1%, a difference of 0.020%), Immigrants from Norway (84.1%, a difference of 0.020%), Immigrants from Nicaragua (84.1%, a difference of 0.060%), and Subsaharan African (84.1%, a difference of 0.060%).
| Demographics | Rating | Rank | In Labor Force | Age 35-44 |
| Immigrants | Barbados | 13.2 /100 | #214 | Poor 84.1% |
| Europeans | 12.2 /100 | #215 | Poor 84.1% |
| Nicaraguans | 12.1 /100 | #216 | Poor 84.1% |
| Immigrants | Norway | 11.7 /100 | #217 | Poor 84.1% |
| Immigrants | Nicaragua | 9.4 /100 | #218 | Tragic 84.1% |
| Sub-Saharan Africans | 9.3 /100 | #219 | Tragic 84.1% |
| French | 7.5 /100 | #220 | Tragic 84.0% |
| Icelanders | 6.7 /100 | #221 | Tragic 84.0% |
| Assyrians/Chaldeans/Syriacs | 6.6 /100 | #222 | Tragic 84.0% |
| Immigrants | Panama | 6.4 /100 | #223 | Tragic 84.0% |
| U.S. Virgin Islanders | 6.1 /100 | #224 | Tragic 84.0% |
| Immigrants | Burma/Myanmar | 6.1 /100 | #225 | Tragic 84.0% |
| Panamanians | 5.4 /100 | #226 | Tragic 84.0% |
| British West Indians | 5.3 /100 | #227 | Tragic 84.0% |
| Welsh | 5.3 /100 | #228 | Tragic 84.0% |
| Immigrants | Thailand | 4.7 /100 | #229 | Tragic 84.0% |
| Immigrants | Iraq | 3.7 /100 | #230 | Tragic 83.9% |
| Scottish | 3.2 /100 | #231 | Tragic 83.9% |
| Native Hawaiians | 3.0 /100 | #232 | Tragic 83.9% |
| Immigrants | Germany | 2.8 /100 | #233 | Tragic 83.9% |
| Immigrants | Oceania | 2.6 /100 | #234 | Tragic 83.9% |