Choctaw vs Chinese In Labor Force | Age 35-44
COMPARE
Choctaw
Chinese
In Labor Force | Age 35-44
In Labor Force | Age 35-44 Comparison
Choctaw
Chinese
80.5%
IN LABOR FORCE | AGE 35-44
0.0/ 100
METRIC RATING
324th/ 347
METRIC RANK
85.1%
IN LABOR FORCE | AGE 35-44
99.4/ 100
METRIC RATING
57th/ 347
METRIC RANK
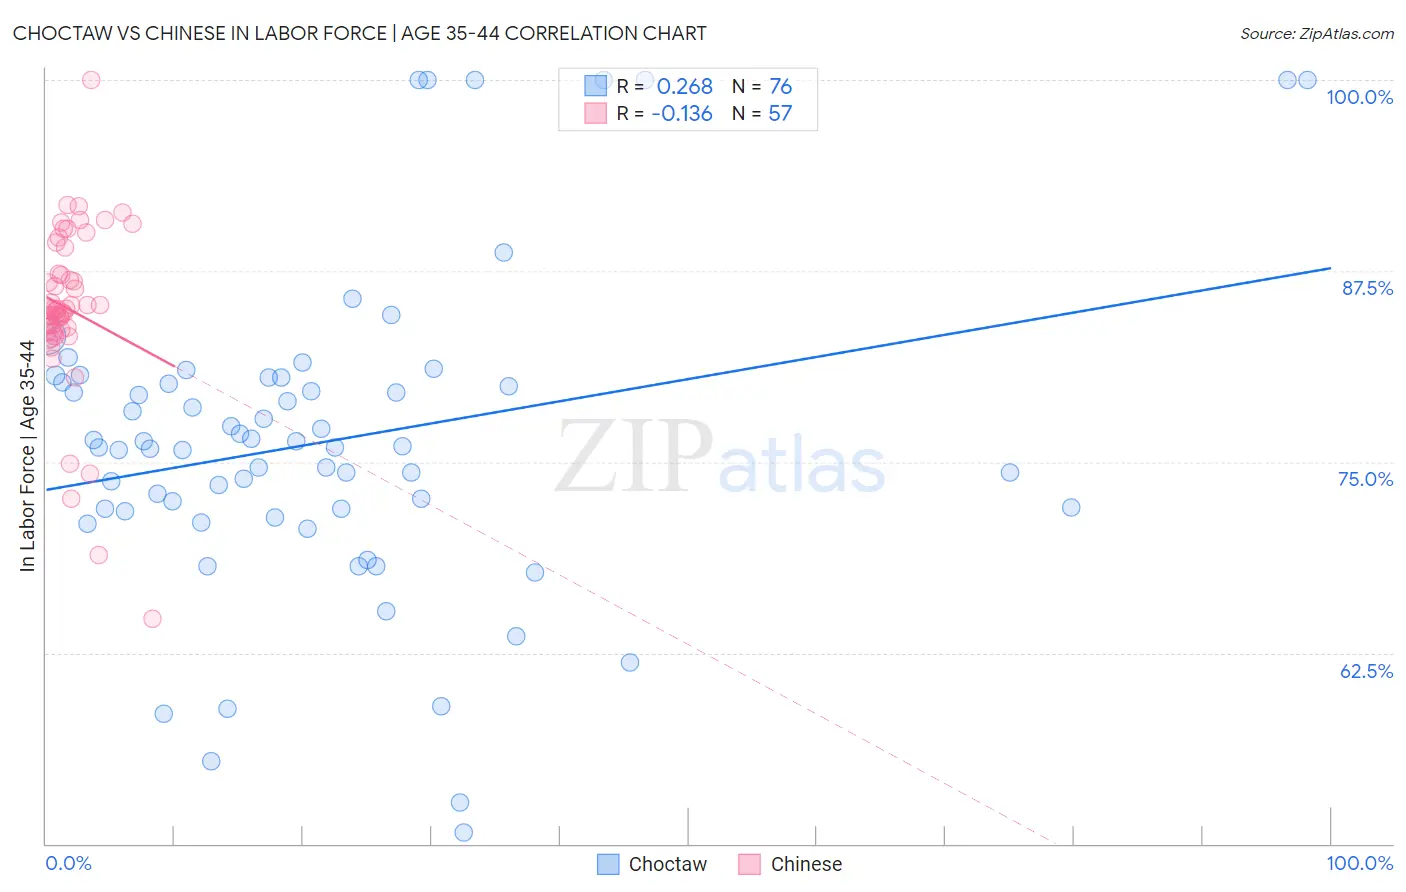
Choctaw vs Chinese In Labor Force | Age 35-44 Correlation Chart
The statistical analysis conducted on geographies consisting of 269,650,989 people shows a weak positive correlation between the proportion of Choctaw and labor force participation rate among population between the ages 35 and 44 in the United States with a correlation coefficient (R) of 0.268 and weighted average of 80.5%. Similarly, the statistical analysis conducted on geographies consisting of 64,807,570 people shows a poor negative correlation between the proportion of Chinese and labor force participation rate among population between the ages 35 and 44 in the United States with a correlation coefficient (R) of -0.136 and weighted average of 85.1%, a difference of 5.6%.
In Labor Force | Age 35-44 Correlation Summary
| Measurement | Choctaw | Chinese |
| Minimum | 50.8% | 64.7% |
| Maximum | 100.0% | 100.0% |
| Range | 49.2% | 35.3% |
| Mean | 76.4% | 85.0% |
| Median | 76.0% | 85.0% |
| Interquartile 25% (IQ1) | 71.8% | 83.6% |
| Interquartile 75% (IQ3) | 80.4% | 88.2% |
| Interquartile Range (IQR) | 8.5% | 4.6% |
| Standard Deviation (Sample) | 10.5% | 5.6% |
| Standard Deviation (Population) | 10.4% | 5.6% |
Similar Demographics by In Labor Force | Age 35-44
Demographics Similar to Choctaw by In Labor Force | Age 35-44
In terms of in labor force | age 35-44, the demographic groups most similar to Choctaw are Yaqui (80.5%, a difference of 0.010%), Paiute (80.6%, a difference of 0.13%), Dutch West Indian (80.4%, a difference of 0.15%), Puerto Rican (80.7%, a difference of 0.19%), and Seminole (80.4%, a difference of 0.19%).
| Demographics | Rating | Rank | In Labor Force | Age 35-44 |
| Cherokee | 0.0 /100 | #317 | Tragic 81.4% |
| Alaskan Athabascans | 0.0 /100 | #318 | Tragic 81.3% |
| Inupiat | 0.0 /100 | #319 | Tragic 80.9% |
| Chickasaw | 0.0 /100 | #320 | Tragic 80.9% |
| Puerto Ricans | 0.0 /100 | #321 | Tragic 80.7% |
| Paiute | 0.0 /100 | #322 | Tragic 80.6% |
| Yaqui | 0.0 /100 | #323 | Tragic 80.5% |
| Choctaw | 0.0 /100 | #324 | Tragic 80.5% |
| Dutch West Indians | 0.0 /100 | #325 | Tragic 80.4% |
| Seminole | 0.0 /100 | #326 | Tragic 80.4% |
| Sioux | 0.0 /100 | #327 | Tragic 80.2% |
| Creek | 0.0 /100 | #328 | Tragic 80.0% |
| Menominee | 0.0 /100 | #329 | Tragic 79.7% |
| Cheyenne | 0.0 /100 | #330 | Tragic 79.5% |
| Houma | 0.0 /100 | #331 | Tragic 79.5% |
Demographics Similar to Chinese by In Labor Force | Age 35-44
In terms of in labor force | age 35-44, the demographic groups most similar to Chinese are Slovak (85.1%, a difference of 0.010%), Serbian (85.1%, a difference of 0.010%), Albanian (85.1%, a difference of 0.010%), Immigrants from Croatia (85.1%, a difference of 0.020%), and Turkish (85.1%, a difference of 0.030%).
| Demographics | Rating | Rank | In Labor Force | Age 35-44 |
| Thais | 99.7 /100 | #50 | Exceptional 85.2% |
| Immigrants | Albania | 99.7 /100 | #51 | Exceptional 85.1% |
| Immigrants | Kenya | 99.6 /100 | #52 | Exceptional 85.1% |
| Taiwanese | 99.6 /100 | #53 | Exceptional 85.1% |
| Turks | 99.5 /100 | #54 | Exceptional 85.1% |
| Soviet Union | 99.5 /100 | #55 | Exceptional 85.1% |
| Immigrants | Croatia | 99.5 /100 | #56 | Exceptional 85.1% |
| Chinese | 99.4 /100 | #57 | Exceptional 85.1% |
| Slovaks | 99.4 /100 | #58 | Exceptional 85.1% |
| Serbians | 99.4 /100 | #59 | Exceptional 85.1% |
| Albanians | 99.4 /100 | #60 | Exceptional 85.1% |
| Immigrants | Latvia | 99.3 /100 | #61 | Exceptional 85.0% |
| Immigrants | Moldova | 99.3 /100 | #62 | Exceptional 85.0% |
| Immigrants | Uganda | 99.3 /100 | #63 | Exceptional 85.0% |
| Swedes | 99.2 /100 | #64 | Exceptional 85.0% |