Chippewa vs Yakama In Labor Force | Age 25-29
COMPARE
Chippewa
Yakama
In Labor Force | Age 25-29
In Labor Force | Age 25-29 Comparison
Chippewa
Yakama
82.9%
IN LABOR FORCE | AGE 25-29
0.0/ 100
METRIC RATING
295th/ 347
METRIC RANK
80.6%
IN LABOR FORCE | AGE 25-29
0.0/ 100
METRIC RATING
329th/ 347
METRIC RANK
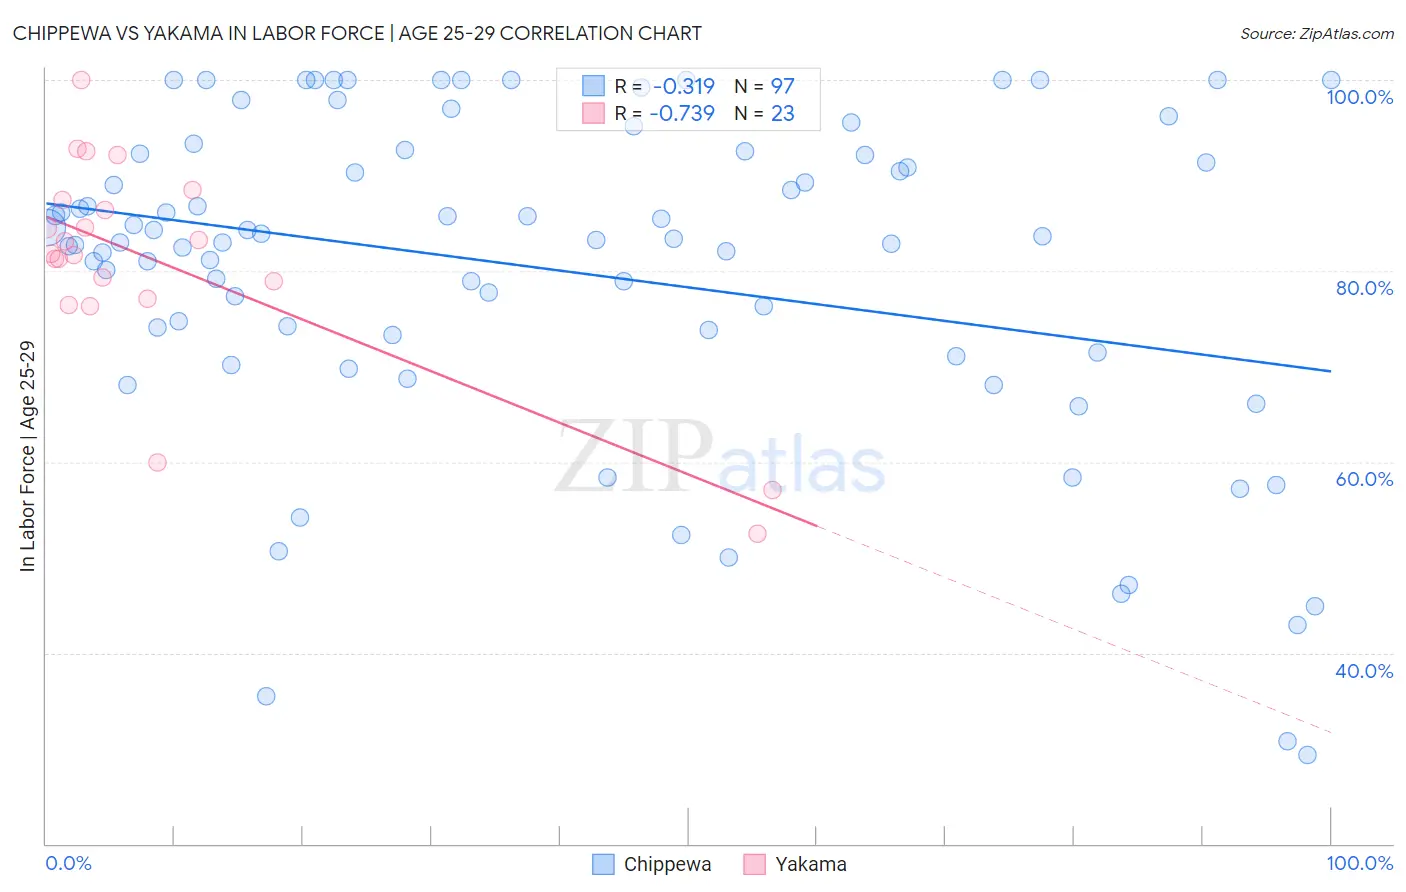
Chippewa vs Yakama In Labor Force | Age 25-29 Correlation Chart
The statistical analysis conducted on geographies consisting of 215,004,507 people shows a mild negative correlation between the proportion of Chippewa and labor force participation rate among population between the ages 25 and 29 in the United States with a correlation coefficient (R) of -0.319 and weighted average of 82.9%. Similarly, the statistical analysis conducted on geographies consisting of 19,913,753 people shows a strong negative correlation between the proportion of Yakama and labor force participation rate among population between the ages 25 and 29 in the United States with a correlation coefficient (R) of -0.739 and weighted average of 80.6%, a difference of 2.9%.
In Labor Force | Age 25-29 Correlation Summary
| Measurement | Chippewa | Yakama |
| Minimum | 29.3% | 52.5% |
| Maximum | 100.0% | 100.0% |
| Range | 70.7% | 47.5% |
| Mean | 80.2% | 80.8% |
| Median | 83.3% | 81.8% |
| Interquartile 25% (IQ1) | 72.3% | 77.1% |
| Interquartile 75% (IQ3) | 92.4% | 87.4% |
| Interquartile Range (IQR) | 20.1% | 10.3% |
| Standard Deviation (Sample) | 17.1% | 11.3% |
| Standard Deviation (Population) | 17.0% | 11.0% |
Similar Demographics by In Labor Force | Age 25-29
Demographics Similar to Chippewa by In Labor Force | Age 25-29
In terms of in labor force | age 25-29, the demographic groups most similar to Chippewa are Nepalese (82.9%, a difference of 0.0%), Immigrants from Nicaragua (82.9%, a difference of 0.0%), Potawatomi (82.9%, a difference of 0.0%), Immigrants from Latin America (82.9%, a difference of 0.010%), and Native Hawaiian (82.9%, a difference of 0.020%).
| Demographics | Rating | Rank | In Labor Force | Age 25-29 |
| Ottawa | 0.0 /100 | #288 | Tragic 83.0% |
| Immigrants | Micronesia | 0.0 /100 | #289 | Tragic 83.0% |
| Immigrants | Bangladesh | 0.0 /100 | #290 | Tragic 83.0% |
| Hawaiians | 0.0 /100 | #291 | Tragic 83.0% |
| Immigrants | Guyana | 0.0 /100 | #292 | Tragic 83.0% |
| Immigrants | Latin America | 0.0 /100 | #293 | Tragic 82.9% |
| Nepalese | 0.0 /100 | #294 | Tragic 82.9% |
| Chippewa | 0.0 /100 | #295 | Tragic 82.9% |
| Immigrants | Nicaragua | 0.0 /100 | #296 | Tragic 82.9% |
| Potawatomi | 0.0 /100 | #297 | Tragic 82.9% |
| Native Hawaiians | 0.0 /100 | #298 | Tragic 82.9% |
| Fijians | 0.0 /100 | #299 | Tragic 82.9% |
| Spanish American Indians | 0.0 /100 | #300 | Tragic 82.9% |
| Vietnamese | 0.0 /100 | #301 | Tragic 82.8% |
| Immigrants | Belize | 0.0 /100 | #302 | Tragic 82.8% |
Demographics Similar to Yakama by In Labor Force | Age 25-29
In terms of in labor force | age 25-29, the demographic groups most similar to Yakama are Creek (80.7%, a difference of 0.11%), Puerto Rican (80.4%, a difference of 0.23%), Ute (80.8%, a difference of 0.26%), Cheyenne (80.3%, a difference of 0.37%), and Choctaw (81.0%, a difference of 0.46%).
| Demographics | Rating | Rank | In Labor Force | Age 25-29 |
| Kiowa | 0.0 /100 | #322 | Tragic 81.6% |
| Alaska Natives | 0.0 /100 | #323 | Tragic 81.6% |
| Houma | 0.0 /100 | #324 | Tragic 81.2% |
| Dutch West Indians | 0.0 /100 | #325 | Tragic 81.1% |
| Choctaw | 0.0 /100 | #326 | Tragic 81.0% |
| Ute | 0.0 /100 | #327 | Tragic 80.8% |
| Creek | 0.0 /100 | #328 | Tragic 80.7% |
| Yakama | 0.0 /100 | #329 | Tragic 80.6% |
| Puerto Ricans | 0.0 /100 | #330 | Tragic 80.4% |
| Cheyenne | 0.0 /100 | #331 | Tragic 80.3% |
| Inupiat | 0.0 /100 | #332 | Tragic 79.8% |
| Sioux | 0.0 /100 | #333 | Tragic 79.7% |
| Yuman | 0.0 /100 | #334 | Tragic 79.3% |
| Natives/Alaskans | 0.0 /100 | #335 | Tragic 79.3% |
| Apache | 0.0 /100 | #336 | Tragic 79.2% |