Immigrants from Jordan vs Yakama In Labor Force | Age 25-29
COMPARE
Immigrants from Jordan
Yakama
In Labor Force | Age 25-29
In Labor Force | Age 25-29 Comparison
Immigrants from Jordan
Yakama
84.4%
IN LABOR FORCE | AGE 25-29
12.8/ 100
METRIC RATING
209th/ 347
METRIC RANK
80.6%
IN LABOR FORCE | AGE 25-29
0.0/ 100
METRIC RATING
329th/ 347
METRIC RANK
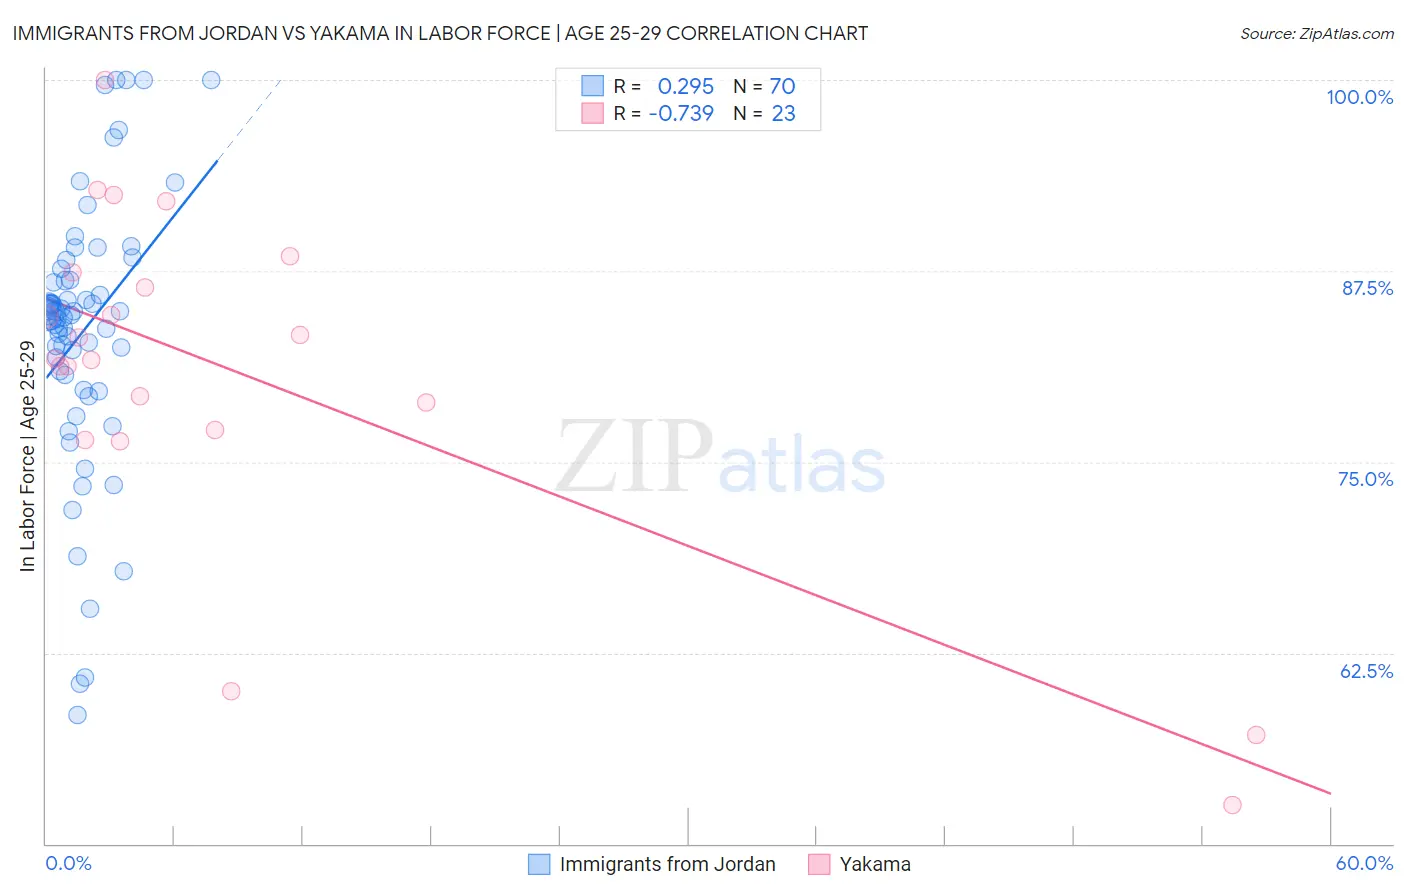
Immigrants from Jordan vs Yakama In Labor Force | Age 25-29 Correlation Chart
The statistical analysis conducted on geographies consisting of 181,276,232 people shows a weak positive correlation between the proportion of Immigrants from Jordan and labor force participation rate among population between the ages 25 and 29 in the United States with a correlation coefficient (R) of 0.295 and weighted average of 84.4%. Similarly, the statistical analysis conducted on geographies consisting of 19,913,753 people shows a strong negative correlation between the proportion of Yakama and labor force participation rate among population between the ages 25 and 29 in the United States with a correlation coefficient (R) of -0.739 and weighted average of 80.6%, a difference of 4.7%.
In Labor Force | Age 25-29 Correlation Summary
| Measurement | Immigrants from Jordan | Yakama |
| Minimum | 58.5% | 52.5% |
| Maximum | 100.0% | 100.0% |
| Range | 41.5% | 47.5% |
| Mean | 83.6% | 80.8% |
| Median | 84.7% | 81.8% |
| Interquartile 25% (IQ1) | 80.7% | 77.1% |
| Interquartile 75% (IQ3) | 86.9% | 87.4% |
| Interquartile Range (IQR) | 6.2% | 10.3% |
| Standard Deviation (Sample) | 8.8% | 11.3% |
| Standard Deviation (Population) | 8.7% | 11.0% |
Similar Demographics by In Labor Force | Age 25-29
Demographics Similar to Immigrants from Jordan by In Labor Force | Age 25-29
In terms of in labor force | age 25-29, the demographic groups most similar to Immigrants from Jordan are Chinese (84.3%, a difference of 0.0%), Immigrants from Venezuela (84.3%, a difference of 0.0%), Immigrants from Armenia (84.4%, a difference of 0.010%), Immigrants from Indonesia (84.4%, a difference of 0.010%), and Immigrants from Cambodia (84.4%, a difference of 0.020%).
| Demographics | Rating | Rank | In Labor Force | Age 25-29 |
| Afghans | 15.9 /100 | #202 | Poor 84.4% |
| Immigrants | Afghanistan | 15.6 /100 | #203 | Poor 84.4% |
| Venezuelans | 15.1 /100 | #204 | Poor 84.4% |
| Ecuadorians | 14.8 /100 | #205 | Poor 84.4% |
| Immigrants | Cambodia | 14.3 /100 | #206 | Poor 84.4% |
| Immigrants | Armenia | 13.3 /100 | #207 | Poor 84.4% |
| Immigrants | Indonesia | 13.2 /100 | #208 | Poor 84.4% |
| Immigrants | Jordan | 12.8 /100 | #209 | Poor 84.4% |
| Chinese | 12.7 /100 | #210 | Poor 84.3% |
| Immigrants | Venezuela | 12.6 /100 | #211 | Poor 84.3% |
| Sub-Saharan Africans | 11.7 /100 | #212 | Poor 84.3% |
| Japanese | 11.4 /100 | #213 | Poor 84.3% |
| Lebanese | 11.1 /100 | #214 | Poor 84.3% |
| Immigrants | Syria | 10.7 /100 | #215 | Poor 84.3% |
| Israelis | 9.3 /100 | #216 | Tragic 84.3% |
Demographics Similar to Yakama by In Labor Force | Age 25-29
In terms of in labor force | age 25-29, the demographic groups most similar to Yakama are Creek (80.7%, a difference of 0.11%), Puerto Rican (80.4%, a difference of 0.23%), Ute (80.8%, a difference of 0.26%), Cheyenne (80.3%, a difference of 0.37%), and Choctaw (81.0%, a difference of 0.46%).
| Demographics | Rating | Rank | In Labor Force | Age 25-29 |
| Kiowa | 0.0 /100 | #322 | Tragic 81.6% |
| Alaska Natives | 0.0 /100 | #323 | Tragic 81.6% |
| Houma | 0.0 /100 | #324 | Tragic 81.2% |
| Dutch West Indians | 0.0 /100 | #325 | Tragic 81.1% |
| Choctaw | 0.0 /100 | #326 | Tragic 81.0% |
| Ute | 0.0 /100 | #327 | Tragic 80.8% |
| Creek | 0.0 /100 | #328 | Tragic 80.7% |
| Yakama | 0.0 /100 | #329 | Tragic 80.6% |
| Puerto Ricans | 0.0 /100 | #330 | Tragic 80.4% |
| Cheyenne | 0.0 /100 | #331 | Tragic 80.3% |
| Inupiat | 0.0 /100 | #332 | Tragic 79.8% |
| Sioux | 0.0 /100 | #333 | Tragic 79.7% |
| Yuman | 0.0 /100 | #334 | Tragic 79.3% |
| Natives/Alaskans | 0.0 /100 | #335 | Tragic 79.3% |
| Apache | 0.0 /100 | #336 | Tragic 79.2% |