Chippewa vs Maltese In Labor Force | Age 25-29
COMPARE
Chippewa
Maltese
In Labor Force | Age 25-29
In Labor Force | Age 25-29 Comparison
Chippewa
Maltese
82.9%
IN LABOR FORCE | AGE 25-29
0.0/ 100
METRIC RATING
295th/ 347
METRIC RANK
86.0%
IN LABOR FORCE | AGE 25-29
100.0/ 100
METRIC RATING
21st/ 347
METRIC RANK
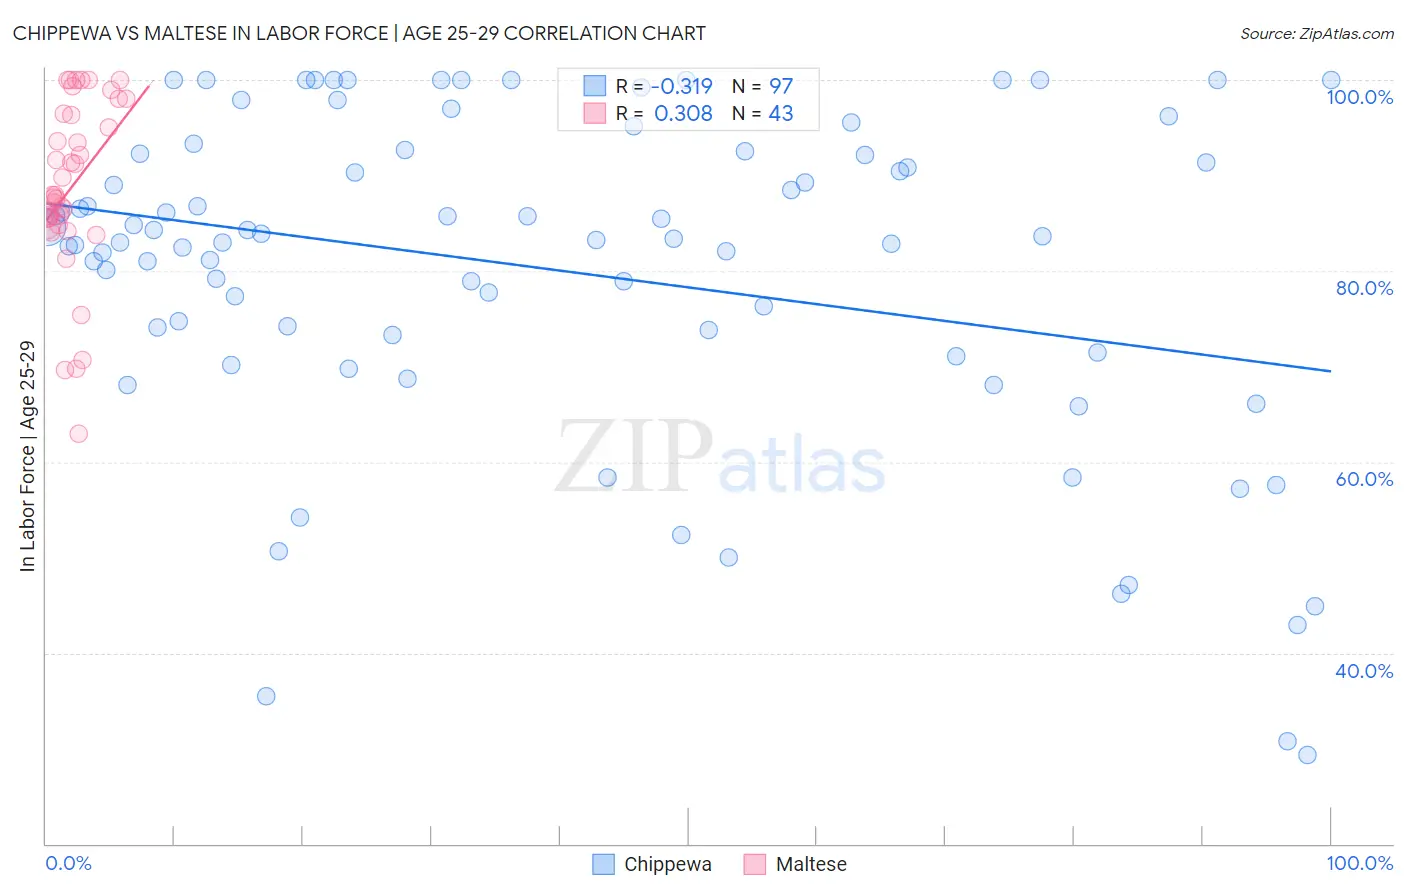
Chippewa vs Maltese In Labor Force | Age 25-29 Correlation Chart
The statistical analysis conducted on geographies consisting of 215,004,507 people shows a mild negative correlation between the proportion of Chippewa and labor force participation rate among population between the ages 25 and 29 in the United States with a correlation coefficient (R) of -0.319 and weighted average of 82.9%. Similarly, the statistical analysis conducted on geographies consisting of 126,432,251 people shows a mild positive correlation between the proportion of Maltese and labor force participation rate among population between the ages 25 and 29 in the United States with a correlation coefficient (R) of 0.308 and weighted average of 86.0%, a difference of 3.7%.
In Labor Force | Age 25-29 Correlation Summary
| Measurement | Chippewa | Maltese |
| Minimum | 29.3% | 63.0% |
| Maximum | 100.0% | 100.0% |
| Range | 70.7% | 37.0% |
| Mean | 80.2% | 88.8% |
| Median | 83.3% | 87.9% |
| Interquartile 25% (IQ1) | 72.3% | 84.9% |
| Interquartile 75% (IQ3) | 92.4% | 96.5% |
| Interquartile Range (IQR) | 20.1% | 11.6% |
| Standard Deviation (Sample) | 17.1% | 9.1% |
| Standard Deviation (Population) | 17.0% | 9.0% |
Similar Demographics by In Labor Force | Age 25-29
Demographics Similar to Chippewa by In Labor Force | Age 25-29
In terms of in labor force | age 25-29, the demographic groups most similar to Chippewa are Nepalese (82.9%, a difference of 0.0%), Immigrants from Nicaragua (82.9%, a difference of 0.0%), Potawatomi (82.9%, a difference of 0.0%), Immigrants from Latin America (82.9%, a difference of 0.010%), and Native Hawaiian (82.9%, a difference of 0.020%).
| Demographics | Rating | Rank | In Labor Force | Age 25-29 |
| Ottawa | 0.0 /100 | #288 | Tragic 83.0% |
| Immigrants | Micronesia | 0.0 /100 | #289 | Tragic 83.0% |
| Immigrants | Bangladesh | 0.0 /100 | #290 | Tragic 83.0% |
| Hawaiians | 0.0 /100 | #291 | Tragic 83.0% |
| Immigrants | Guyana | 0.0 /100 | #292 | Tragic 83.0% |
| Immigrants | Latin America | 0.0 /100 | #293 | Tragic 82.9% |
| Nepalese | 0.0 /100 | #294 | Tragic 82.9% |
| Chippewa | 0.0 /100 | #295 | Tragic 82.9% |
| Immigrants | Nicaragua | 0.0 /100 | #296 | Tragic 82.9% |
| Potawatomi | 0.0 /100 | #297 | Tragic 82.9% |
| Native Hawaiians | 0.0 /100 | #298 | Tragic 82.9% |
| Fijians | 0.0 /100 | #299 | Tragic 82.9% |
| Spanish American Indians | 0.0 /100 | #300 | Tragic 82.9% |
| Vietnamese | 0.0 /100 | #301 | Tragic 82.8% |
| Immigrants | Belize | 0.0 /100 | #302 | Tragic 82.8% |
Demographics Similar to Maltese by In Labor Force | Age 25-29
In terms of in labor force | age 25-29, the demographic groups most similar to Maltese are Immigrants from Ireland (86.0%, a difference of 0.010%), Cambodian (86.0%, a difference of 0.010%), Cape Verdean (86.0%, a difference of 0.020%), Bulgarian (86.0%, a difference of 0.030%), and Immigrants from Uganda (86.0%, a difference of 0.030%).
| Demographics | Rating | Rank | In Labor Force | Age 25-29 |
| Latvians | 100.0 /100 | #14 | Exceptional 86.1% |
| Bolivians | 100.0 /100 | #15 | Exceptional 86.1% |
| Immigrants | Bolivia | 100.0 /100 | #16 | Exceptional 86.1% |
| Bermudans | 100.0 /100 | #17 | Exceptional 86.0% |
| Bulgarians | 100.0 /100 | #18 | Exceptional 86.0% |
| Cape Verdeans | 100.0 /100 | #19 | Exceptional 86.0% |
| Immigrants | Ireland | 100.0 /100 | #20 | Exceptional 86.0% |
| Maltese | 100.0 /100 | #21 | Exceptional 86.0% |
| Cambodians | 100.0 /100 | #22 | Exceptional 86.0% |
| Immigrants | Uganda | 100.0 /100 | #23 | Exceptional 86.0% |
| Immigrants | Eastern Africa | 100.0 /100 | #24 | Exceptional 86.0% |
| Sudanese | 100.0 /100 | #25 | Exceptional 85.9% |
| Immigrants | North Macedonia | 100.0 /100 | #26 | Exceptional 85.9% |
| Paraguayans | 100.0 /100 | #27 | Exceptional 85.9% |
| Ugandans | 100.0 /100 | #28 | Exceptional 85.9% |