Chippewa vs Immigrants from Jamaica In Labor Force | Age 25-29
COMPARE
Chippewa
Immigrants from Jamaica
In Labor Force | Age 25-29
In Labor Force | Age 25-29 Comparison
Chippewa
Immigrants from Jamaica
82.9%
IN LABOR FORCE | AGE 25-29
0.0/ 100
METRIC RATING
295th/ 347
METRIC RANK
83.8%
IN LABOR FORCE | AGE 25-29
0.4/ 100
METRIC RATING
244th/ 347
METRIC RANK
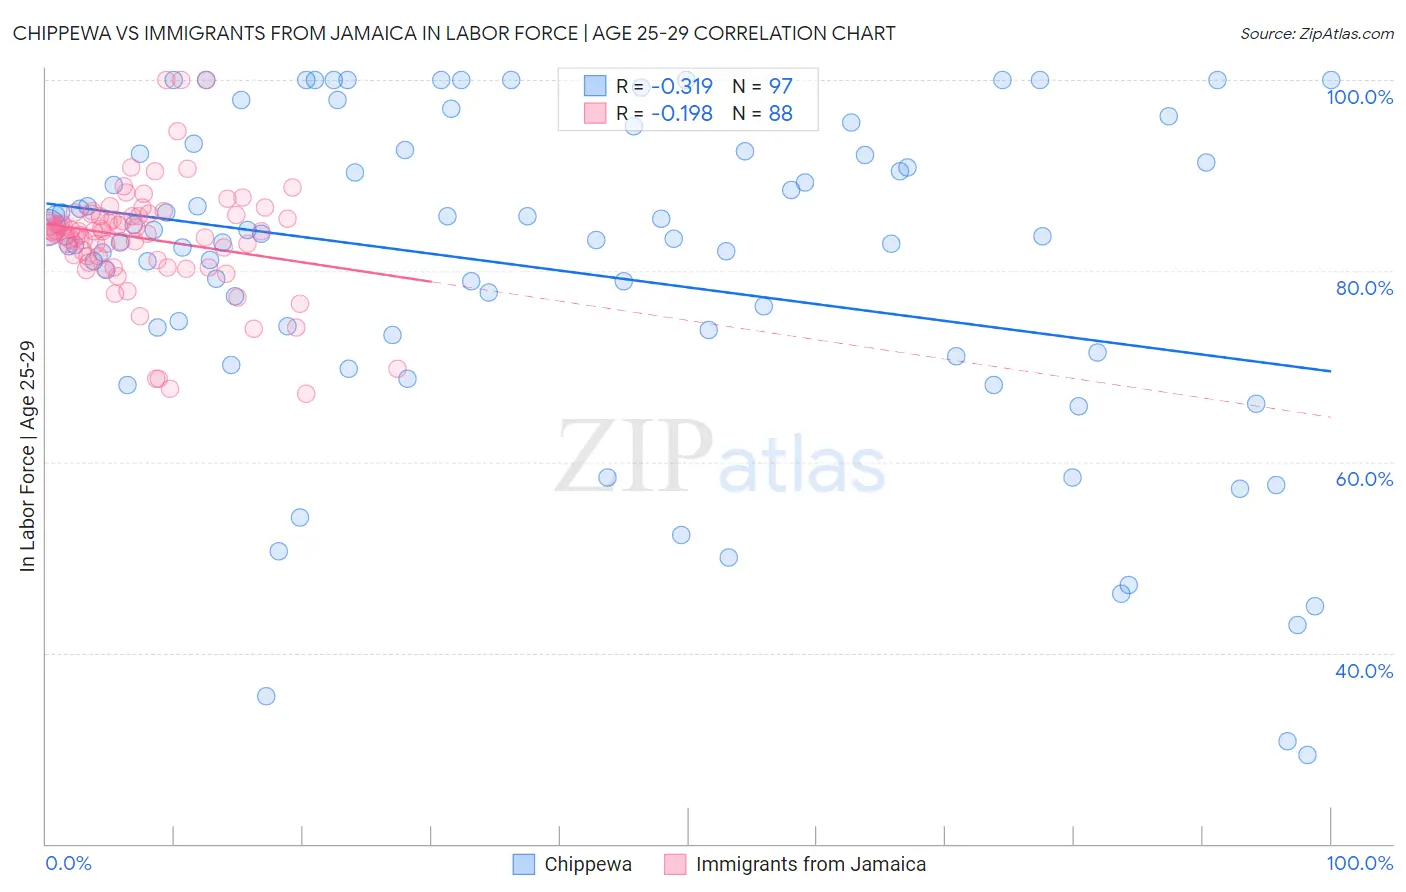
Chippewa vs Immigrants from Jamaica In Labor Force | Age 25-29 Correlation Chart
The statistical analysis conducted on geographies consisting of 215,004,507 people shows a mild negative correlation between the proportion of Chippewa and labor force participation rate among population between the ages 25 and 29 in the United States with a correlation coefficient (R) of -0.319 and weighted average of 82.9%. Similarly, the statistical analysis conducted on geographies consisting of 301,725,989 people shows a poor negative correlation between the proportion of Immigrants from Jamaica and labor force participation rate among population between the ages 25 and 29 in the United States with a correlation coefficient (R) of -0.198 and weighted average of 83.8%, a difference of 1.1%.
In Labor Force | Age 25-29 Correlation Summary
| Measurement | Chippewa | Immigrants from Jamaica |
| Minimum | 29.3% | 67.2% |
| Maximum | 100.0% | 100.0% |
| Range | 70.7% | 32.8% |
| Mean | 80.2% | 83.4% |
| Median | 83.3% | 84.1% |
| Interquartile 25% (IQ1) | 72.3% | 81.3% |
| Interquartile 75% (IQ3) | 92.4% | 85.8% |
| Interquartile Range (IQR) | 20.1% | 4.5% |
| Standard Deviation (Sample) | 17.1% | 5.9% |
| Standard Deviation (Population) | 17.0% | 5.9% |
Similar Demographics by In Labor Force | Age 25-29
Demographics Similar to Chippewa by In Labor Force | Age 25-29
In terms of in labor force | age 25-29, the demographic groups most similar to Chippewa are Nepalese (82.9%, a difference of 0.0%), Immigrants from Nicaragua (82.9%, a difference of 0.0%), Potawatomi (82.9%, a difference of 0.0%), Immigrants from Latin America (82.9%, a difference of 0.010%), and Native Hawaiian (82.9%, a difference of 0.020%).
| Demographics | Rating | Rank | In Labor Force | Age 25-29 |
| Ottawa | 0.0 /100 | #288 | Tragic 83.0% |
| Immigrants | Micronesia | 0.0 /100 | #289 | Tragic 83.0% |
| Immigrants | Bangladesh | 0.0 /100 | #290 | Tragic 83.0% |
| Hawaiians | 0.0 /100 | #291 | Tragic 83.0% |
| Immigrants | Guyana | 0.0 /100 | #292 | Tragic 83.0% |
| Immigrants | Latin America | 0.0 /100 | #293 | Tragic 82.9% |
| Nepalese | 0.0 /100 | #294 | Tragic 82.9% |
| Chippewa | 0.0 /100 | #295 | Tragic 82.9% |
| Immigrants | Nicaragua | 0.0 /100 | #296 | Tragic 82.9% |
| Potawatomi | 0.0 /100 | #297 | Tragic 82.9% |
| Native Hawaiians | 0.0 /100 | #298 | Tragic 82.9% |
| Fijians | 0.0 /100 | #299 | Tragic 82.9% |
| Spanish American Indians | 0.0 /100 | #300 | Tragic 82.9% |
| Vietnamese | 0.0 /100 | #301 | Tragic 82.8% |
| Immigrants | Belize | 0.0 /100 | #302 | Tragic 82.8% |
Demographics Similar to Immigrants from Jamaica by In Labor Force | Age 25-29
In terms of in labor force | age 25-29, the demographic groups most similar to Immigrants from Jamaica are Iroquois (83.8%, a difference of 0.0%), Salvadoran (83.8%, a difference of 0.040%), U.S. Virgin Islander (83.8%, a difference of 0.050%), Cree (83.8%, a difference of 0.050%), and Immigrants from El Salvador (83.7%, a difference of 0.070%).
| Demographics | Rating | Rank | In Labor Force | Age 25-29 |
| Immigrants | Immigrants | 0.9 /100 | #237 | Tragic 83.9% |
| Immigrants | Uzbekistan | 0.8 /100 | #238 | Tragic 83.9% |
| Jamaicans | 0.8 /100 | #239 | Tragic 83.9% |
| Trinidadians and Tobagonians | 0.7 /100 | #240 | Tragic 83.9% |
| Alsatians | 0.7 /100 | #241 | Tragic 83.9% |
| U.S. Virgin Islanders | 0.6 /100 | #242 | Tragic 83.8% |
| Salvadorans | 0.5 /100 | #243 | Tragic 83.8% |
| Immigrants | Jamaica | 0.4 /100 | #244 | Tragic 83.8% |
| Iroquois | 0.4 /100 | #245 | Tragic 83.8% |
| Cree | 0.3 /100 | #246 | Tragic 83.8% |
| Immigrants | El Salvador | 0.3 /100 | #247 | Tragic 83.7% |
| Immigrants | Nonimmigrants | 0.3 /100 | #248 | Tragic 83.7% |
| Hmong | 0.3 /100 | #249 | Tragic 83.7% |
| Central Americans | 0.2 /100 | #250 | Tragic 83.7% |
| Bahamians | 0.2 /100 | #251 | Tragic 83.7% |