Immigrants from Romania vs Yakama In Labor Force | Age 25-29

COMPARE

Immigrants from Romania
Race
Ancestry
AfghanAfricanAlaska NativeAlaskan AthabascanAlbanianAleutAlsatianAmericanApacheArabArapahoArgentineanArmenianAssyrian/Chaldean/SyriacAustralianAustrianBahamianBangladeshiBarbadianBasqueBelgianBelizeanBermudanBhutaneseBlackfeetBolivianBrazilianBritishBritish West IndianBulgarianBurmeseCajunCambodianCanadianCape VerdeanCarpatho RusynCelticCentral AmericanCentral American IndianCherokeeCheyenneChickasawChileanChineseChippewaChoctawColombianColvilleComancheCosta RicanCreeCreekCroatianCrowCubanCypriotCzechCzechoslovakianDanishDelawareDominicanDutchDutch West IndianEastern EuropeanEcuadorianEgyptianEnglishEstonianEthiopianEuropeanFijianFilipinoFinnishFrenchFrench American IndianFrench CanadianGermanGerman RussianGhanaianGreekGuamanian/ChamorroGuatemalanGuyaneseHaitianHmongHonduranHopiHoumaHungarianIcelanderIndian (Asian)IndonesianInupiatIranianIraqiIrishIroquoisIsraeliItalianJamaicanJapaneseJordanianKenyanKiowaKoreanLaotianLatvianLebaneseLiberianLithuanianLumbeeLuxembourgerMacedonianMalaysianMalteseMarshalleseMenomineeMexicanMexican American IndianMongolianMoroccanNative HawaiianNavajoNepaleseNew ZealanderNicaraguanNigerianNorthern EuropeanNorwegianOkinawanOsageOttawaPaiutePakistaniPalestinianPanamanianParaguayanPennsylvania GermanPeruvianPimaPolishPortuguesePotawatomiPuebloPuerto RicanPuget Sound SalishRomanianRussianSalvadoranSamoanScandinavianScotch-IrishScottishSeminoleSenegaleseSerbianShoshoneSierra LeoneanSiouxSlavicSlovakSloveneSomaliSouth AfricanSouth AmericanSouth American IndianSoviet UnionSpaniardSpanishSpanish AmericanSpanish American IndianSri LankanSubsaharan AfricanSudaneseSwedishSwissSyrianTaiwaneseThaiTlingit-HaidaTohono O'OdhamTonganTrinidadian and TobagonianTsimshianTurkishU.S. Virgin IslanderUgandanUkrainianUruguayanUteVenezuelanVietnameseWelshWest IndianYaquiYugoslavianYumanYup'ikZimbabwean
Immigration
NonimmigrantsImmigrantsAfghanistanAfricaAlbaniaArgentinaArmeniaAsiaAustraliaAustriaBahamasBangladeshBarbadosBelarusBelgiumBelizeBoliviaBosnia and HerzegovinaBrazilBulgariaBurma/MyanmarCabo VerdeCambodiaCameroonCanadaCaribbeanCentral AmericaChileChinaColombiaCongoCosta RicaCroatiaCubaCzechoslovakiaDenmarkDominicaDominican RepublicEastern AfricaEastern AsiaEastern EuropeEcuadorEgyptEl SalvadorEnglandEritreaEthiopiaEuropeFijiFranceGermanyGhanaGreeceGrenadaGuatemalaGuyanaHaitiHondurasHong KongHungaryIndiaIndonesiaIranIraqIrelandIsraelItalyJamaicaJapanJordanKazakhstanKenyaKoreaKuwaitLaosLatin AmericaLatviaLebanonLiberiaLithuaniaMalaysiaMexicoMicronesiaMiddle AfricaMoldovaMoroccoNepalNetherlandsNicaraguaNigeriaNorth AmericaNorth MacedoniaNorthern AfricaNorthern EuropeNorwayOceaniaPakistanPanamaPeruPhilippinesPolandPortugalRomaniaRussiaSaudi ArabiaScotlandSenegalSerbiaSierra LeoneSingaporeSomaliaSouth AfricaSouth AmericaSouth Central AsiaSouth Eastern AsiaSouthern EuropeSpainSri LankaSt. Vincent and the GrenadinesSudanSwedenSwitzerlandSyriaTaiwanThailandTrinidad and TobagoTurkeyUgandaUkraineUruguayUzbekistanVenezuelaVietnamWest IndiesWestern AfricaWestern AsiaWestern EuropeYemenZaireZimbabweAzores
Yakama
Race
Ancestry
AfghanAfricanAlaska NativeAlaskan AthabascanAlbanianAleutAlsatianAmericanApacheArabArapahoArgentineanArmenianAssyrian/Chaldean/SyriacAustralianAustrianBahamianBangladeshiBarbadianBasqueBelgianBelizeanBermudanBhutaneseBlackfeetBolivianBrazilianBritishBritish West IndianBulgarianBurmeseCajunCambodianCanadianCape VerdeanCarpatho RusynCelticCentral AmericanCentral American IndianCherokeeCheyenneChickasawChileanChineseChippewaChoctawColombianColvilleComancheCosta RicanCreeCreekCroatianCrowCubanCypriotCzechCzechoslovakianDanishDelawareDominicanDutchDutch West IndianEastern EuropeanEcuadorianEgyptianEnglishEstonianEthiopianEuropeanFijianFilipinoFinnishFrenchFrench American IndianFrench CanadianGermanGerman RussianGhanaianGreekGuamanian/ChamorroGuatemalanGuyaneseHaitianHmongHonduranHopiHoumaHungarianIcelanderIndian (Asian)IndonesianInupiatIranianIraqiIrishIroquoisIsraeliItalianJamaicanJapaneseJordanianKenyanKiowaKoreanLaotianLatvianLebaneseLiberianLithuanianLumbeeLuxembourgerMacedonianMalaysianMalteseMarshalleseMenomineeMexicanMexican American IndianMongolianMoroccanNative HawaiianNavajoNepaleseNew ZealanderNicaraguanNigerianNorthern EuropeanNorwegianOkinawanOsageOttawaPaiutePakistaniPalestinianPanamanianParaguayanPennsylvania GermanPeruvianPimaPolishPortuguesePotawatomiPuebloPuerto RicanPuget Sound SalishRomanianRussianSalvadoranSamoanScandinavianScotch-IrishScottishSeminoleSenegaleseSerbianShoshoneSierra LeoneanSiouxSlavicSlovakSloveneSomaliSouth AfricanSouth AmericanSouth American IndianSoviet UnionSpaniardSpanishSpanish AmericanSpanish American IndianSri LankanSubsaharan AfricanSudaneseSwedishSwissSyrianTaiwaneseThaiTlingit-HaidaTohono O'OdhamTonganTrinidadian and TobagonianTsimshianTurkishU.S. Virgin IslanderUgandanUkrainianUruguayanUteVenezuelanVietnameseWelshWest IndianYakamaYaquiYugoslavianYumanYup'ikZimbabwean
Immigration
NonimmigrantsImmigrantsAfghanistanAfricaAlbaniaArgentinaArmeniaAsiaAustraliaAustriaBahamasBangladeshBarbadosBelarusBelgiumBelizeBoliviaBosnia and HerzegovinaBrazilBulgariaBurma/MyanmarCabo VerdeCambodiaCameroonCanadaCaribbeanCentral AmericaChileChinaColombiaCongoCosta RicaCroatiaCubaCzechoslovakiaDenmarkDominicaDominican RepublicEastern AfricaEastern AsiaEastern EuropeEcuadorEgyptEl SalvadorEnglandEritreaEthiopiaEuropeFijiFranceGermanyGhanaGreeceGrenadaGuatemalaGuyanaHaitiHondurasHong KongHungaryIndiaIndonesiaIranIraqIrelandIsraelItalyJamaicaJapanJordanKazakhstanKenyaKoreaKuwaitLaosLatin AmericaLatviaLebanonLiberiaLithuaniaMalaysiaMexicoMicronesiaMiddle AfricaMoldovaMoroccoNepalNetherlandsNicaraguaNigeriaNorth AmericaNorth MacedoniaNorthern AfricaNorthern EuropeNorwayOceaniaPakistanPanamaPeruPhilippinesPolandPortugalRussiaSaudi ArabiaScotlandSenegalSerbiaSierra LeoneSingaporeSomaliaSouth AfricaSouth AmericaSouth Central AsiaSouth Eastern AsiaSouthern EuropeSpainSri LankaSt. Vincent and the GrenadinesSudanSwedenSwitzerlandSyriaTaiwanThailandTrinidad and TobagoTurkeyUgandaUkraineUruguayUzbekistanVenezuelaVietnamWest IndiesWestern AfricaWestern AsiaWestern EuropeYemenZaireZimbabweAzores
In Labor Force | Age 25-29
Income
Poverty
Unemployment
Labor Participation
Family Structure
Vehicle Availability
Education Level
Disability

In Labor Force | Age 25-29 Comparison

Immigrants from Romania

Yakama

Exceptional
Tragic
85.1%
IN LABOR FORCE | AGE 25-29
94.6/ 100
METRIC RATING
96th/ 347
METRIC RANK
80.6%
IN LABOR FORCE | AGE 25-29
0.0/ 100
METRIC RATING
329th/ 347
METRIC RANK

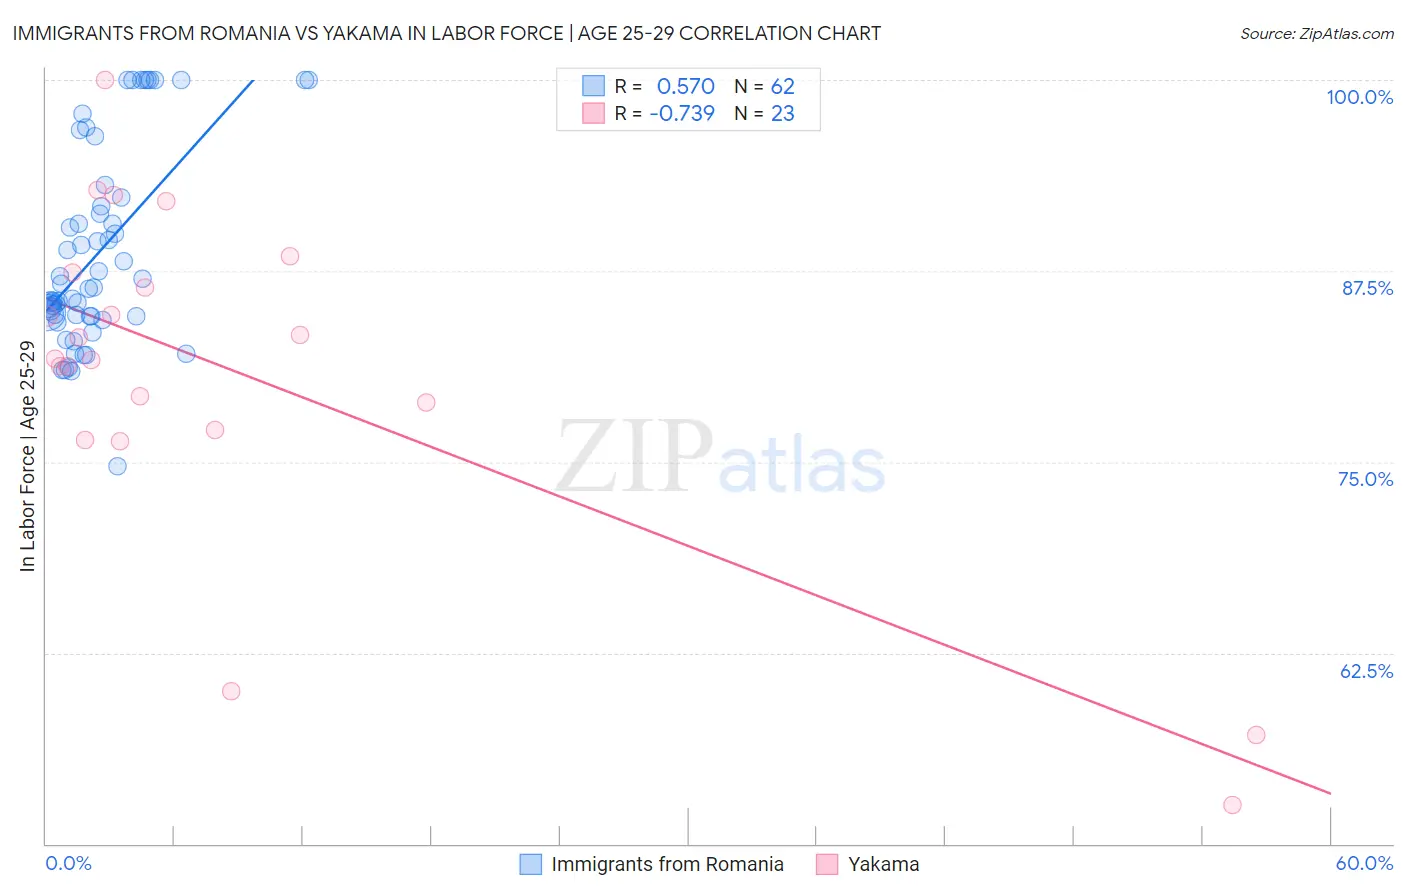
Immigrants from Romania vs Yakama In Labor Force | Age 25-29 Correlation Chart

The statistical analysis conducted on geographies consisting of 256,997,701 people shows a substantial positive correlation between the proportion of Immigrants from Romania and labor force participation rate among population between the ages 25 and 29 in the United States with a correlation coefficient (R) of 0.570 and weighted average of 85.1%. Similarly, the statistical analysis conducted on geographies consisting of 19,913,753 people shows a strong negative correlation between the proportion of Yakama and labor force participation rate among population between the ages 25 and 29 in the United States with a correlation coefficient (R) of -0.739 and weighted average of 80.6%, a difference of 5.6%.
Immigrants from Romania vs Yakama In Labor Force | Age 25-29

In Labor Force | Age 25-29 Correlation Summary

MeasurementImmigrants from RomaniaYakama
Minimum74.7%52.5%
Maximum100.0%100.0%
Range25.3%47.5%
Mean88.8%80.8%
Median86.5%81.8%
Interquartile 25% (IQ1)84.5%77.1%
Interquartile 75% (IQ3)92.3%87.4%
Interquartile Range (IQR)7.8%10.3%
Standard Deviation (Sample)6.5%11.3%
Standard Deviation (Population)6.4%11.0%

Similar Demographics by In Labor Force | Age 25-29

Demographics Similar to Immigrants from Romania by In Labor Force | Age 25-29

In terms of in labor force | age 25-29, the demographic groups most similar to Immigrants from Romania are Immigrants from Netherlands (85.1%, a difference of 0.0%), Immigrants from Korea (85.1%, a difference of 0.010%), Immigrants from Sudan (85.1%, a difference of 0.010%), Mongolian (85.1%, a difference of 0.020%), and Bangladeshi (85.1%, a difference of 0.020%).
DemographicsRating | RankIn Labor Force | Age 25-29
Immigrants | France
96.3
/100
|
#89
Exceptional
85.2%
Burmese
95.9
/100
|
#90
Exceptional
85.1%
Immigrants | Moldova
95.8
/100
|
#91
Exceptional
85.1%
Immigrants | Costa Rica
95.5
/100
|
#92
Exceptional
85.1%
Austrians
95.3
/100
|
#93
Exceptional
85.1%
Immigrants | Korea
94.8
/100
|
#94
Exceptional
85.1%
Immigrants | Netherlands
94.6
/100
|
#95
Exceptional
85.1%
Immigrants | Romania
94.6
/100
|
#96
Exceptional
85.1%
Immigrants | Sudan
94.3
/100
|
#97
Exceptional
85.1%
Mongolians
94.1
/100
|
#98
Exceptional
85.1%
Bangladeshis
94.0
/100
|
#99
Exceptional
85.1%
Immigrants | Switzerland
93.9
/100
|
#100
Exceptional
85.1%
Egyptians
93.8
/100
|
#101
Exceptional
85.1%
Slavs
93.7
/100
|
#102
Exceptional
85.1%
Immigrants | Japan
93.5
/100
|
#103
Exceptional
85.1%

Demographics Similar to Yakama by In Labor Force | Age 25-29

In terms of in labor force | age 25-29, the demographic groups most similar to Yakama are Creek (80.7%, a difference of 0.11%), Puerto Rican (80.4%, a difference of 0.23%), Ute (80.8%, a difference of 0.26%), Cheyenne (80.3%, a difference of 0.37%), and Choctaw (81.0%, a difference of 0.46%).
DemographicsRating | RankIn Labor Force | Age 25-29
Kiowa
0.0
/100
|
#322
Tragic
81.6%
Alaska Natives
0.0
/100
|
#323
Tragic
81.6%
Houma
0.0
/100
|
#324
Tragic
81.2%
Dutch West Indians
0.0
/100
|
#325
Tragic
81.1%
Choctaw
0.0
/100
|
#326
Tragic
81.0%
Ute
0.0
/100
|
#327
Tragic
80.8%
Creek
0.0
/100
|
#328
Tragic
80.7%
Yakama
0.0
/100
|
#329
Tragic
80.6%
Puerto Ricans
0.0
/100
|
#330
Tragic
80.4%
Cheyenne
0.0
/100
|
#331
Tragic
80.3%
Inupiat
0.0
/100
|
#332
Tragic
79.8%
Sioux
0.0
/100
|
#333
Tragic
79.7%
Yuman
0.0
/100
|
#334
Tragic
79.3%
Natives/Alaskans
0.0
/100
|
#335
Tragic
79.3%
Apache
0.0
/100
|
#336
Tragic
79.2%