Immigrants from Indonesia vs Maltese In Labor Force | Age 25-29
COMPARE
Immigrants from Indonesia
Maltese
In Labor Force | Age 25-29
In Labor Force | Age 25-29 Comparison
Immigrants from Indonesia
Maltese
84.4%
IN LABOR FORCE | AGE 25-29
13.2/ 100
METRIC RATING
208th/ 347
METRIC RANK
86.0%
IN LABOR FORCE | AGE 25-29
100.0/ 100
METRIC RATING
21st/ 347
METRIC RANK
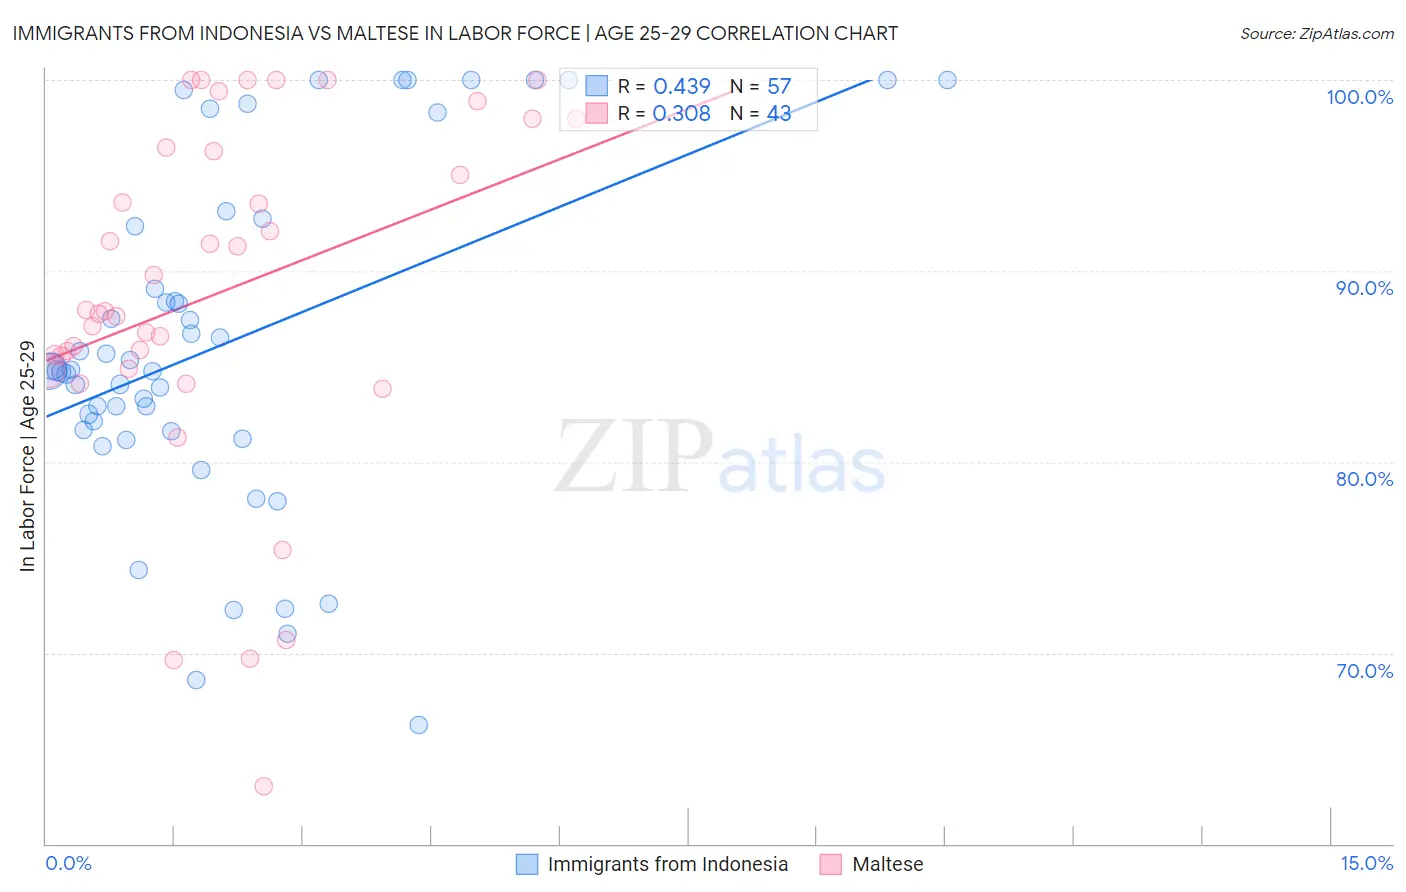
Immigrants from Indonesia vs Maltese In Labor Force | Age 25-29 Correlation Chart
The statistical analysis conducted on geographies consisting of 215,766,008 people shows a moderate positive correlation between the proportion of Immigrants from Indonesia and labor force participation rate among population between the ages 25 and 29 in the United States with a correlation coefficient (R) of 0.439 and weighted average of 84.4%. Similarly, the statistical analysis conducted on geographies consisting of 126,432,251 people shows a mild positive correlation between the proportion of Maltese and labor force participation rate among population between the ages 25 and 29 in the United States with a correlation coefficient (R) of 0.308 and weighted average of 86.0%, a difference of 1.9%.
In Labor Force | Age 25-29 Correlation Summary
| Measurement | Immigrants from Indonesia | Maltese |
| Minimum | 66.2% | 63.0% |
| Maximum | 100.0% | 100.0% |
| Range | 33.8% | 37.0% |
| Mean | 86.2% | 88.8% |
| Median | 84.8% | 87.9% |
| Interquartile 25% (IQ1) | 81.6% | 84.9% |
| Interquartile 75% (IQ3) | 92.5% | 96.5% |
| Interquartile Range (IQR) | 10.9% | 11.6% |
| Standard Deviation (Sample) | 8.8% | 9.1% |
| Standard Deviation (Population) | 8.8% | 9.0% |
Similar Demographics by In Labor Force | Age 25-29
Demographics Similar to Immigrants from Indonesia by In Labor Force | Age 25-29
In terms of in labor force | age 25-29, the demographic groups most similar to Immigrants from Indonesia are Immigrants from Armenia (84.4%, a difference of 0.0%), Immigrants from Jordan (84.4%, a difference of 0.010%), Chinese (84.3%, a difference of 0.010%), Immigrants from Venezuela (84.3%, a difference of 0.010%), and Immigrants from Cambodia (84.4%, a difference of 0.020%).
| Demographics | Rating | Rank | In Labor Force | Age 25-29 |
| Laotians | 16.6 /100 | #201 | Poor 84.4% |
| Afghans | 15.9 /100 | #202 | Poor 84.4% |
| Immigrants | Afghanistan | 15.6 /100 | #203 | Poor 84.4% |
| Venezuelans | 15.1 /100 | #204 | Poor 84.4% |
| Ecuadorians | 14.8 /100 | #205 | Poor 84.4% |
| Immigrants | Cambodia | 14.3 /100 | #206 | Poor 84.4% |
| Immigrants | Armenia | 13.3 /100 | #207 | Poor 84.4% |
| Immigrants | Indonesia | 13.2 /100 | #208 | Poor 84.4% |
| Immigrants | Jordan | 12.8 /100 | #209 | Poor 84.4% |
| Chinese | 12.7 /100 | #210 | Poor 84.3% |
| Immigrants | Venezuela | 12.6 /100 | #211 | Poor 84.3% |
| Sub-Saharan Africans | 11.7 /100 | #212 | Poor 84.3% |
| Japanese | 11.4 /100 | #213 | Poor 84.3% |
| Lebanese | 11.1 /100 | #214 | Poor 84.3% |
| Immigrants | Syria | 10.7 /100 | #215 | Poor 84.3% |
Demographics Similar to Maltese by In Labor Force | Age 25-29
In terms of in labor force | age 25-29, the demographic groups most similar to Maltese are Immigrants from Ireland (86.0%, a difference of 0.010%), Cambodian (86.0%, a difference of 0.010%), Cape Verdean (86.0%, a difference of 0.020%), Bulgarian (86.0%, a difference of 0.030%), and Immigrants from Uganda (86.0%, a difference of 0.030%).
| Demographics | Rating | Rank | In Labor Force | Age 25-29 |
| Latvians | 100.0 /100 | #14 | Exceptional 86.1% |
| Bolivians | 100.0 /100 | #15 | Exceptional 86.1% |
| Immigrants | Bolivia | 100.0 /100 | #16 | Exceptional 86.1% |
| Bermudans | 100.0 /100 | #17 | Exceptional 86.0% |
| Bulgarians | 100.0 /100 | #18 | Exceptional 86.0% |
| Cape Verdeans | 100.0 /100 | #19 | Exceptional 86.0% |
| Immigrants | Ireland | 100.0 /100 | #20 | Exceptional 86.0% |
| Maltese | 100.0 /100 | #21 | Exceptional 86.0% |
| Cambodians | 100.0 /100 | #22 | Exceptional 86.0% |
| Immigrants | Uganda | 100.0 /100 | #23 | Exceptional 86.0% |
| Immigrants | Eastern Africa | 100.0 /100 | #24 | Exceptional 86.0% |
| Sudanese | 100.0 /100 | #25 | Exceptional 85.9% |
| Immigrants | North Macedonia | 100.0 /100 | #26 | Exceptional 85.9% |
| Paraguayans | 100.0 /100 | #27 | Exceptional 85.9% |
| Ugandans | 100.0 /100 | #28 | Exceptional 85.9% |