Chippewa vs Maltese In Labor Force | Age 16-19
COMPARE
Chippewa
Maltese
In Labor Force | Age 16-19
In Labor Force | Age 16-19 Comparison
Chippewa
Maltese
43.8%
IN LABOR FORCE | AGE 16-19
100.0/ 100
METRIC RATING
14th/ 347
METRIC RANK
38.5%
IN LABOR FORCE | AGE 16-19
98.6/ 100
METRIC RATING
110th/ 347
METRIC RANK
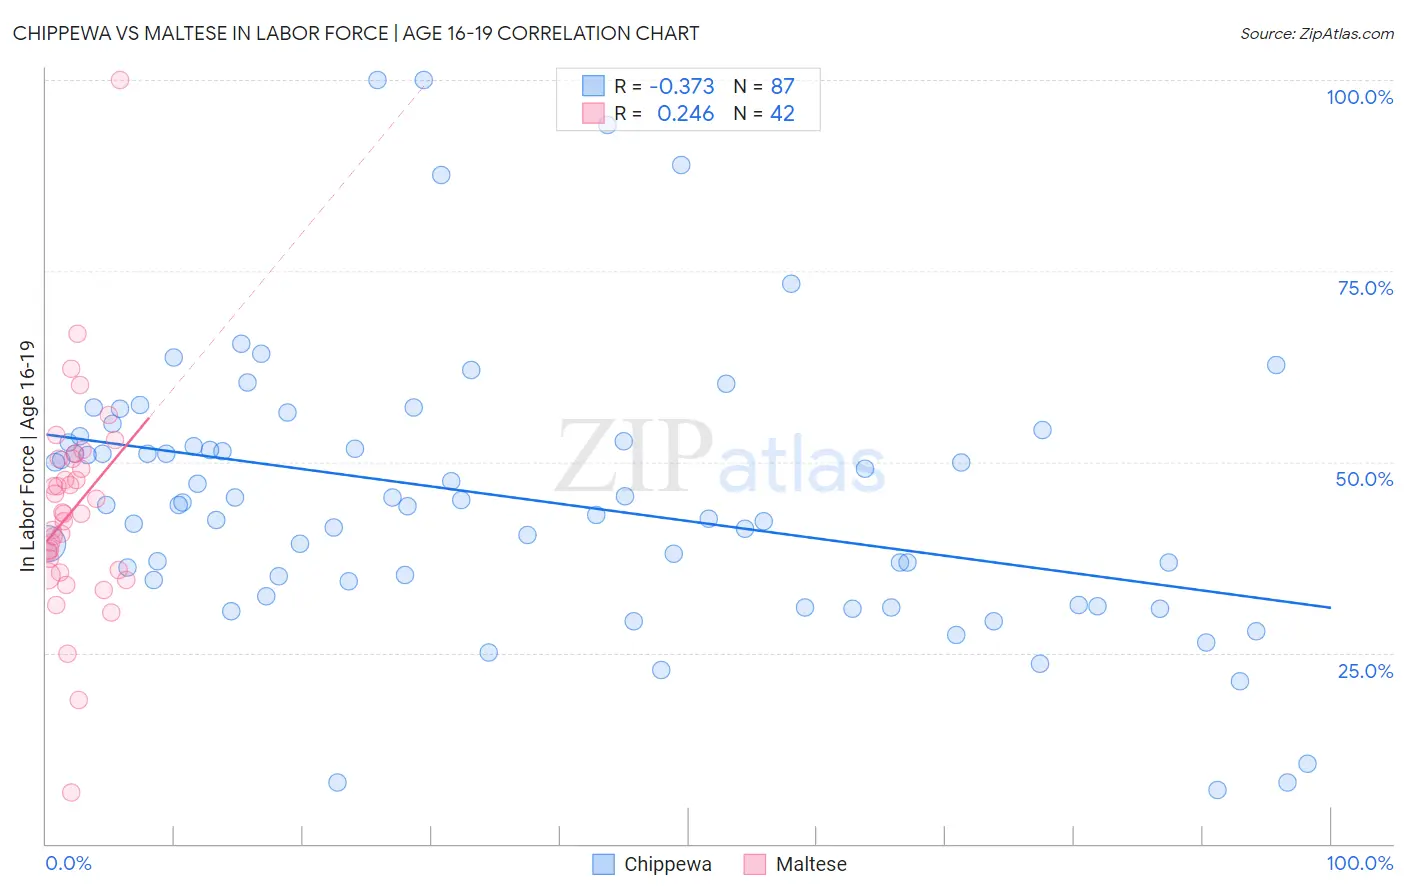
Chippewa vs Maltese In Labor Force | Age 16-19 Correlation Chart
The statistical analysis conducted on geographies consisting of 214,800,226 people shows a mild negative correlation between the proportion of Chippewa and labor force participation rate among population between the ages 16 and 19 in the United States with a correlation coefficient (R) of -0.373 and weighted average of 43.8%. Similarly, the statistical analysis conducted on geographies consisting of 126,398,157 people shows a weak positive correlation between the proportion of Maltese and labor force participation rate among population between the ages 16 and 19 in the United States with a correlation coefficient (R) of 0.246 and weighted average of 38.5%, a difference of 13.7%.
In Labor Force | Age 16-19 Correlation Summary
| Measurement | Chippewa | Maltese |
| Minimum | 7.1% | 6.7% |
| Maximum | 100.0% | 100.0% |
| Range | 92.9% | 93.3% |
| Mean | 45.3% | 43.7% |
| Median | 44.4% | 43.2% |
| Interquartile 25% (IQ1) | 34.3% | 35.9% |
| Interquartile 75% (IQ3) | 52.7% | 50.4% |
| Interquartile Range (IQR) | 18.4% | 14.5% |
| Standard Deviation (Sample) | 18.0% | 14.2% |
| Standard Deviation (Population) | 17.9% | 14.1% |
Similar Demographics by In Labor Force | Age 16-19
Demographics Similar to Chippewa by In Labor Force | Age 16-19
In terms of in labor force | age 16-19, the demographic groups most similar to Chippewa are Dutch (43.8%, a difference of 0.10%), Slovene (43.7%, a difference of 0.26%), Finnish (43.9%, a difference of 0.29%), Czech (43.6%, a difference of 0.36%), and Scandinavian (43.6%, a difference of 0.43%).
| Demographics | Rating | Rank | In Labor Force | Age 16-19 |
| Danes | 100.0 /100 | #7 | Exceptional 44.7% |
| Immigrants | Cabo Verde | 100.0 /100 | #8 | Exceptional 44.7% |
| Cape Verdeans | 100.0 /100 | #9 | Exceptional 44.5% |
| Germans | 100.0 /100 | #10 | Exceptional 44.2% |
| Swedes | 100.0 /100 | #11 | Exceptional 44.1% |
| Finns | 100.0 /100 | #12 | Exceptional 43.9% |
| Dutch | 100.0 /100 | #13 | Exceptional 43.8% |
| Chippewa | 100.0 /100 | #14 | Exceptional 43.8% |
| Slovenes | 100.0 /100 | #15 | Exceptional 43.7% |
| Czechs | 100.0 /100 | #16 | Exceptional 43.6% |
| Scandinavians | 100.0 /100 | #17 | Exceptional 43.6% |
| French Canadians | 100.0 /100 | #18 | Exceptional 43.6% |
| Belgians | 100.0 /100 | #19 | Exceptional 43.4% |
| Swiss | 100.0 /100 | #20 | Exceptional 43.3% |
| Ottawa | 100.0 /100 | #21 | Exceptional 43.0% |
Demographics Similar to Maltese by In Labor Force | Age 16-19
In terms of in labor force | age 16-19, the demographic groups most similar to Maltese are Crow (38.5%, a difference of 0.060%), Immigrants from Scotland (38.5%, a difference of 0.070%), Immigrants from Ethiopia (38.6%, a difference of 0.12%), Lebanese (38.6%, a difference of 0.12%), and Subsaharan African (38.4%, a difference of 0.20%).
| Demographics | Rating | Rank | In Labor Force | Age 16-19 |
| Immigrants | Cameroon | 99.0 /100 | #103 | Exceptional 38.7% |
| Immigrants | Eritrea | 99.0 /100 | #104 | Exceptional 38.7% |
| Iraqis | 98.9 /100 | #105 | Exceptional 38.6% |
| Delaware | 98.8 /100 | #106 | Exceptional 38.6% |
| Chinese | 98.8 /100 | #107 | Exceptional 38.6% |
| Immigrants | Ethiopia | 98.7 /100 | #108 | Exceptional 38.6% |
| Lebanese | 98.7 /100 | #109 | Exceptional 38.6% |
| Maltese | 98.6 /100 | #110 | Exceptional 38.5% |
| Crow | 98.5 /100 | #111 | Exceptional 38.5% |
| Immigrants | Scotland | 98.5 /100 | #112 | Exceptional 38.5% |
| Sub-Saharan Africans | 98.3 /100 | #113 | Exceptional 38.4% |
| Hawaiians | 98.2 /100 | #114 | Exceptional 38.4% |
| Bulgarians | 97.9 /100 | #115 | Exceptional 38.3% |
| Colville | 97.9 /100 | #116 | Exceptional 38.3% |
| Chickasaw | 97.8 /100 | #117 | Exceptional 38.3% |