Ukrainian vs Maltese In Labor Force | Age 25-29
COMPARE
Ukrainian
Maltese
In Labor Force | Age 25-29
In Labor Force | Age 25-29 Comparison
Ukrainians
Maltese
85.2%
IN LABOR FORCE | AGE 25-29
96.7/ 100
METRIC RATING
86th/ 347
METRIC RANK
86.0%
IN LABOR FORCE | AGE 25-29
100.0/ 100
METRIC RATING
21st/ 347
METRIC RANK
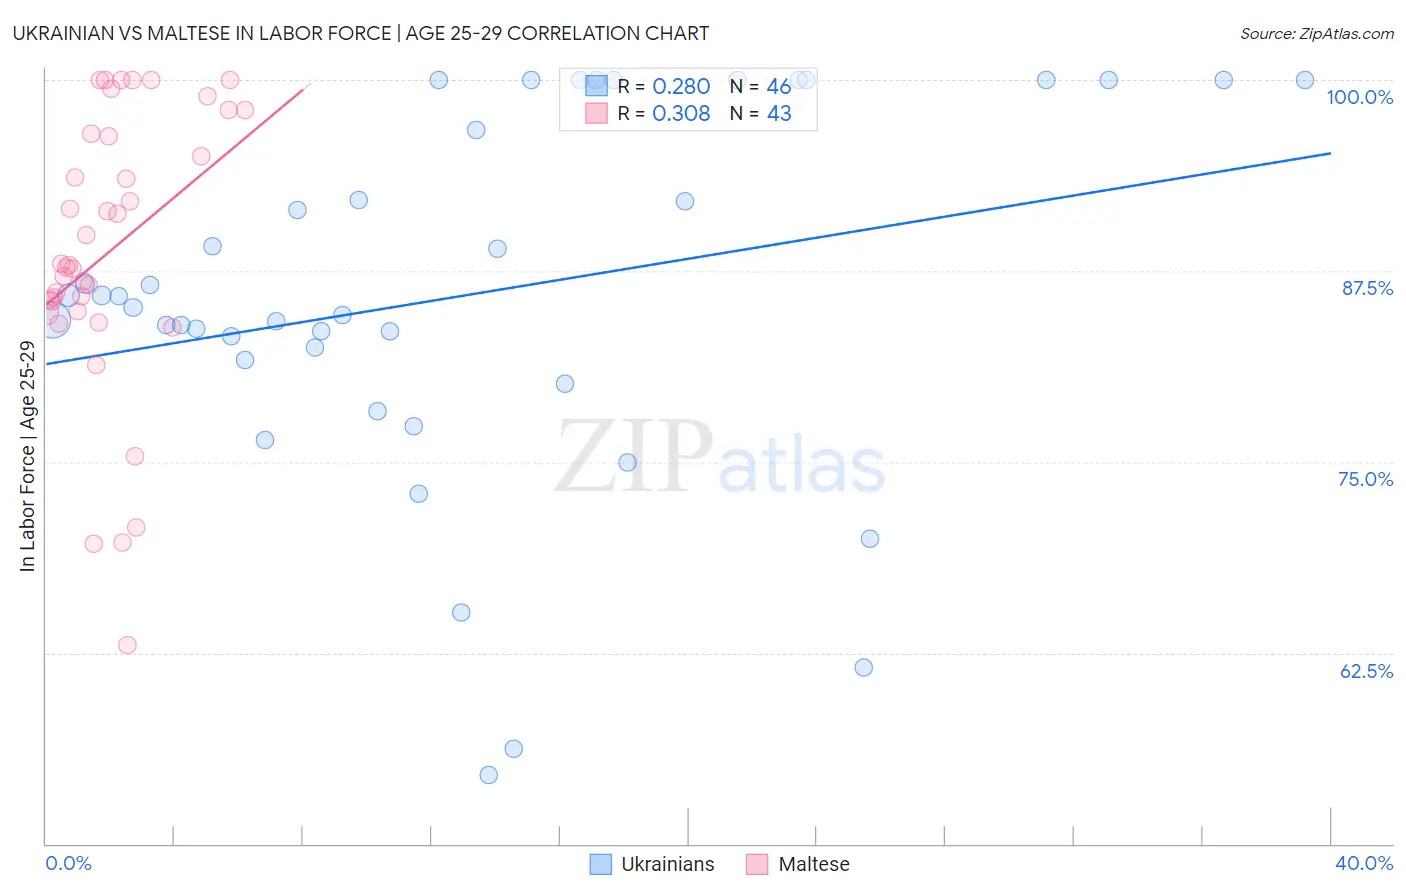
Ukrainian vs Maltese In Labor Force | Age 25-29 Correlation Chart
The statistical analysis conducted on geographies consisting of 448,388,747 people shows a weak positive correlation between the proportion of Ukrainians and labor force participation rate among population between the ages 25 and 29 in the United States with a correlation coefficient (R) of 0.280 and weighted average of 85.2%. Similarly, the statistical analysis conducted on geographies consisting of 126,432,251 people shows a mild positive correlation between the proportion of Maltese and labor force participation rate among population between the ages 25 and 29 in the United States with a correlation coefficient (R) of 0.308 and weighted average of 86.0%, a difference of 0.96%.
In Labor Force | Age 25-29 Correlation Summary
| Measurement | Ukrainian | Maltese |
| Minimum | 54.5% | 63.0% |
| Maximum | 100.0% | 100.0% |
| Range | 45.5% | 37.0% |
| Mean | 85.9% | 88.8% |
| Median | 85.5% | 87.9% |
| Interquartile 25% (IQ1) | 81.7% | 84.9% |
| Interquartile 75% (IQ3) | 100.0% | 96.5% |
| Interquartile Range (IQR) | 18.3% | 11.6% |
| Standard Deviation (Sample) | 11.9% | 9.1% |
| Standard Deviation (Population) | 11.8% | 9.0% |
Similar Demographics by In Labor Force | Age 25-29
Demographics Similar to Ukrainians by In Labor Force | Age 25-29
In terms of in labor force | age 25-29, the demographic groups most similar to Ukrainians are Immigrants from Africa (85.2%, a difference of 0.0%), Immigrants from Europe (85.2%, a difference of 0.010%), Immigrants from Eastern Europe (85.2%, a difference of 0.010%), French Canadian (85.2%, a difference of 0.010%), and Immigrants from Croatia (85.2%, a difference of 0.010%).
| Demographics | Rating | Rank | In Labor Force | Age 25-29 |
| Immigrants | Northern Africa | 97.6 /100 | #79 | Exceptional 85.2% |
| Immigrants | Zimbabwe | 97.6 /100 | #80 | Exceptional 85.2% |
| Immigrants | Northern Europe | 97.2 /100 | #81 | Exceptional 85.2% |
| Okinawans | 97.0 /100 | #82 | Exceptional 85.2% |
| Immigrants | Europe | 96.8 /100 | #83 | Exceptional 85.2% |
| Immigrants | Eastern Europe | 96.8 /100 | #84 | Exceptional 85.2% |
| Immigrants | Africa | 96.7 /100 | #85 | Exceptional 85.2% |
| Ukrainians | 96.7 /100 | #86 | Exceptional 85.2% |
| French Canadians | 96.5 /100 | #87 | Exceptional 85.2% |
| Immigrants | Croatia | 96.4 /100 | #88 | Exceptional 85.2% |
| Immigrants | France | 96.3 /100 | #89 | Exceptional 85.2% |
| Burmese | 95.9 /100 | #90 | Exceptional 85.1% |
| Immigrants | Moldova | 95.8 /100 | #91 | Exceptional 85.1% |
| Immigrants | Costa Rica | 95.5 /100 | #92 | Exceptional 85.1% |
| Austrians | 95.3 /100 | #93 | Exceptional 85.1% |
Demographics Similar to Maltese by In Labor Force | Age 25-29
In terms of in labor force | age 25-29, the demographic groups most similar to Maltese are Immigrants from Ireland (86.0%, a difference of 0.010%), Cambodian (86.0%, a difference of 0.010%), Cape Verdean (86.0%, a difference of 0.020%), Bulgarian (86.0%, a difference of 0.030%), and Immigrants from Uganda (86.0%, a difference of 0.030%).
| Demographics | Rating | Rank | In Labor Force | Age 25-29 |
| Latvians | 100.0 /100 | #14 | Exceptional 86.1% |
| Bolivians | 100.0 /100 | #15 | Exceptional 86.1% |
| Immigrants | Bolivia | 100.0 /100 | #16 | Exceptional 86.1% |
| Bermudans | 100.0 /100 | #17 | Exceptional 86.0% |
| Bulgarians | 100.0 /100 | #18 | Exceptional 86.0% |
| Cape Verdeans | 100.0 /100 | #19 | Exceptional 86.0% |
| Immigrants | Ireland | 100.0 /100 | #20 | Exceptional 86.0% |
| Maltese | 100.0 /100 | #21 | Exceptional 86.0% |
| Cambodians | 100.0 /100 | #22 | Exceptional 86.0% |
| Immigrants | Uganda | 100.0 /100 | #23 | Exceptional 86.0% |
| Immigrants | Eastern Africa | 100.0 /100 | #24 | Exceptional 86.0% |
| Sudanese | 100.0 /100 | #25 | Exceptional 85.9% |
| Immigrants | North Macedonia | 100.0 /100 | #26 | Exceptional 85.9% |
| Paraguayans | 100.0 /100 | #27 | Exceptional 85.9% |
| Ugandans | 100.0 /100 | #28 | Exceptional 85.9% |