Immigrants from Eritrea vs Maltese In Labor Force | Age 25-29
COMPARE
Immigrants from Eritrea
Maltese
In Labor Force | Age 25-29
In Labor Force | Age 25-29 Comparison
Immigrants from Eritrea
Maltese
85.7%
IN LABOR FORCE | AGE 25-29
99.9/ 100
METRIC RATING
42nd/ 347
METRIC RANK
86.0%
IN LABOR FORCE | AGE 25-29
100.0/ 100
METRIC RATING
21st/ 347
METRIC RANK
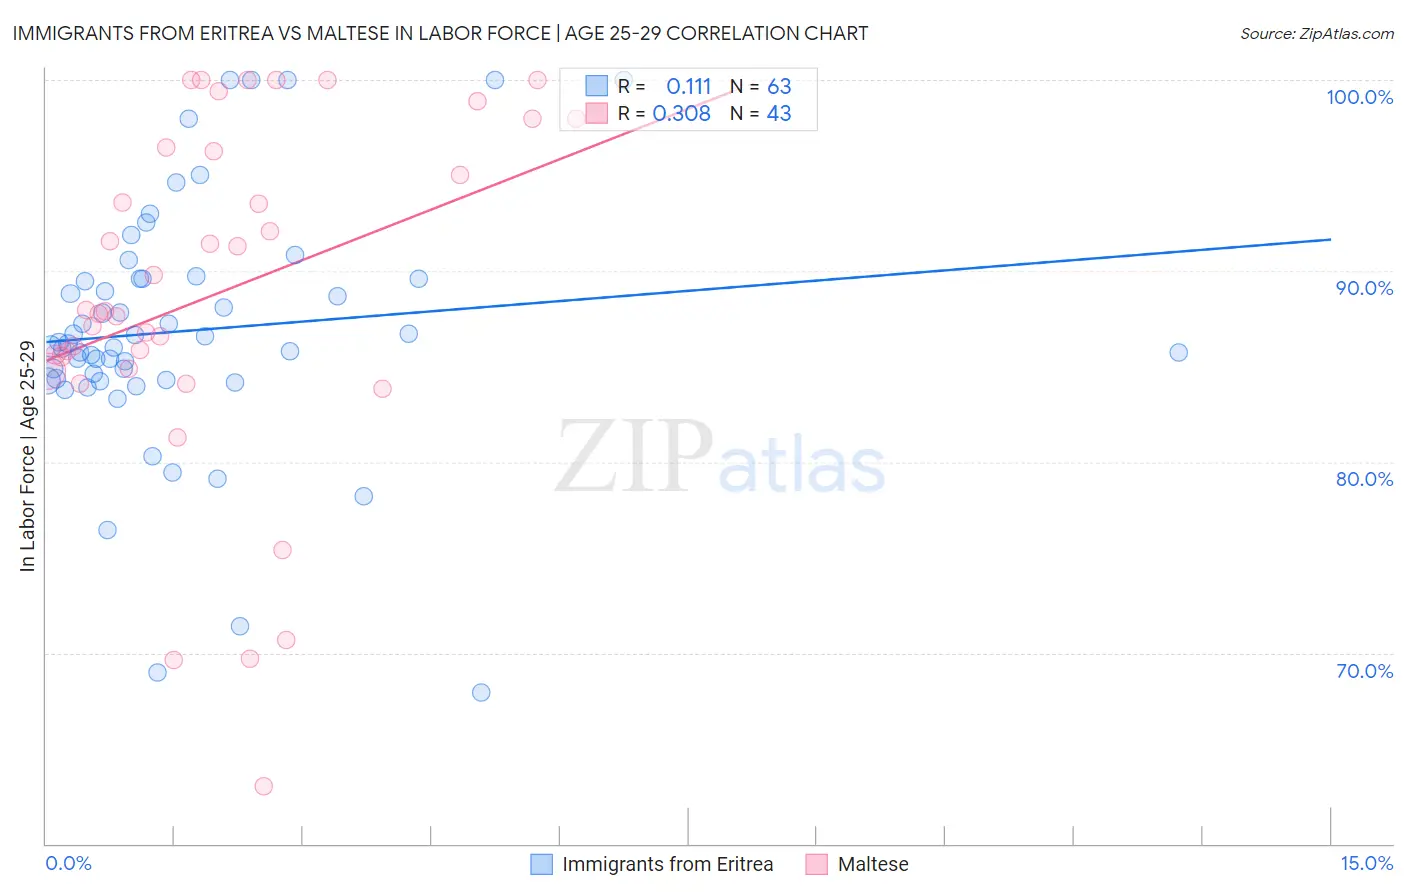
Immigrants from Eritrea vs Maltese In Labor Force | Age 25-29 Correlation Chart
The statistical analysis conducted on geographies consisting of 104,848,070 people shows a poor positive correlation between the proportion of Immigrants from Eritrea and labor force participation rate among population between the ages 25 and 29 in the United States with a correlation coefficient (R) of 0.111 and weighted average of 85.7%. Similarly, the statistical analysis conducted on geographies consisting of 126,432,251 people shows a mild positive correlation between the proportion of Maltese and labor force participation rate among population between the ages 25 and 29 in the United States with a correlation coefficient (R) of 0.308 and weighted average of 86.0%, a difference of 0.35%.
In Labor Force | Age 25-29 Correlation Summary
| Measurement | Immigrants from Eritrea | Maltese |
| Minimum | 67.9% | 63.0% |
| Maximum | 100.0% | 100.0% |
| Range | 32.1% | 37.0% |
| Mean | 86.9% | 88.8% |
| Median | 86.2% | 87.9% |
| Interquartile 25% (IQ1) | 84.3% | 84.9% |
| Interquartile 75% (IQ3) | 89.6% | 96.5% |
| Interquartile Range (IQR) | 5.3% | 11.6% |
| Standard Deviation (Sample) | 6.5% | 9.1% |
| Standard Deviation (Population) | 6.5% | 9.0% |
Similar Demographics by In Labor Force | Age 25-29
Demographics Similar to Immigrants from Eritrea by In Labor Force | Age 25-29
In terms of in labor force | age 25-29, the demographic groups most similar to Immigrants from Eritrea are Immigrants from India (85.7%, a difference of 0.010%), Macedonian (85.7%, a difference of 0.020%), Immigrants from Sierra Leone (85.7%, a difference of 0.020%), Immigrants from Greece (85.7%, a difference of 0.040%), and Immigrants from Albania (85.7%, a difference of 0.050%).
| Demographics | Rating | Rank | In Labor Force | Age 25-29 |
| Cypriots | 99.9 /100 | #35 | Exceptional 85.8% |
| Immigrants | Nepal | 99.9 /100 | #36 | Exceptional 85.8% |
| Poles | 99.9 /100 | #37 | Exceptional 85.8% |
| Sierra Leoneans | 99.9 /100 | #38 | Exceptional 85.8% |
| Croatians | 99.9 /100 | #39 | Exceptional 85.8% |
| Immigrants | Albania | 99.9 /100 | #40 | Exceptional 85.7% |
| Immigrants | Greece | 99.9 /100 | #41 | Exceptional 85.7% |
| Immigrants | Eritrea | 99.9 /100 | #42 | Exceptional 85.7% |
| Immigrants | India | 99.9 /100 | #43 | Exceptional 85.7% |
| Macedonians | 99.9 /100 | #44 | Exceptional 85.7% |
| Immigrants | Sierra Leone | 99.9 /100 | #45 | Exceptional 85.7% |
| Czechs | 99.8 /100 | #46 | Exceptional 85.6% |
| Turks | 99.8 /100 | #47 | Exceptional 85.6% |
| Italians | 99.8 /100 | #48 | Exceptional 85.6% |
| Swedes | 99.8 /100 | #49 | Exceptional 85.6% |
Demographics Similar to Maltese by In Labor Force | Age 25-29
In terms of in labor force | age 25-29, the demographic groups most similar to Maltese are Immigrants from Ireland (86.0%, a difference of 0.010%), Cambodian (86.0%, a difference of 0.010%), Cape Verdean (86.0%, a difference of 0.020%), Bulgarian (86.0%, a difference of 0.030%), and Immigrants from Uganda (86.0%, a difference of 0.030%).
| Demographics | Rating | Rank | In Labor Force | Age 25-29 |
| Latvians | 100.0 /100 | #14 | Exceptional 86.1% |
| Bolivians | 100.0 /100 | #15 | Exceptional 86.1% |
| Immigrants | Bolivia | 100.0 /100 | #16 | Exceptional 86.1% |
| Bermudans | 100.0 /100 | #17 | Exceptional 86.0% |
| Bulgarians | 100.0 /100 | #18 | Exceptional 86.0% |
| Cape Verdeans | 100.0 /100 | #19 | Exceptional 86.0% |
| Immigrants | Ireland | 100.0 /100 | #20 | Exceptional 86.0% |
| Maltese | 100.0 /100 | #21 | Exceptional 86.0% |
| Cambodians | 100.0 /100 | #22 | Exceptional 86.0% |
| Immigrants | Uganda | 100.0 /100 | #23 | Exceptional 86.0% |
| Immigrants | Eastern Africa | 100.0 /100 | #24 | Exceptional 86.0% |
| Sudanese | 100.0 /100 | #25 | Exceptional 85.9% |
| Immigrants | North Macedonia | 100.0 /100 | #26 | Exceptional 85.9% |
| Paraguayans | 100.0 /100 | #27 | Exceptional 85.9% |
| Ugandans | 100.0 /100 | #28 | Exceptional 85.9% |