Chippewa vs Immigrants from Northern Europe In Labor Force | Age 16-19
COMPARE
Chippewa
Immigrants from Northern Europe
In Labor Force | Age 16-19
In Labor Force | Age 16-19 Comparison
Chippewa
Immigrants from Northern Europe
43.8%
IN LABOR FORCE | AGE 16-19
100.0/ 100
METRIC RATING
14th/ 347
METRIC RANK
36.5%
IN LABOR FORCE | AGE 16-19
46.6/ 100
METRIC RATING
177th/ 347
METRIC RANK
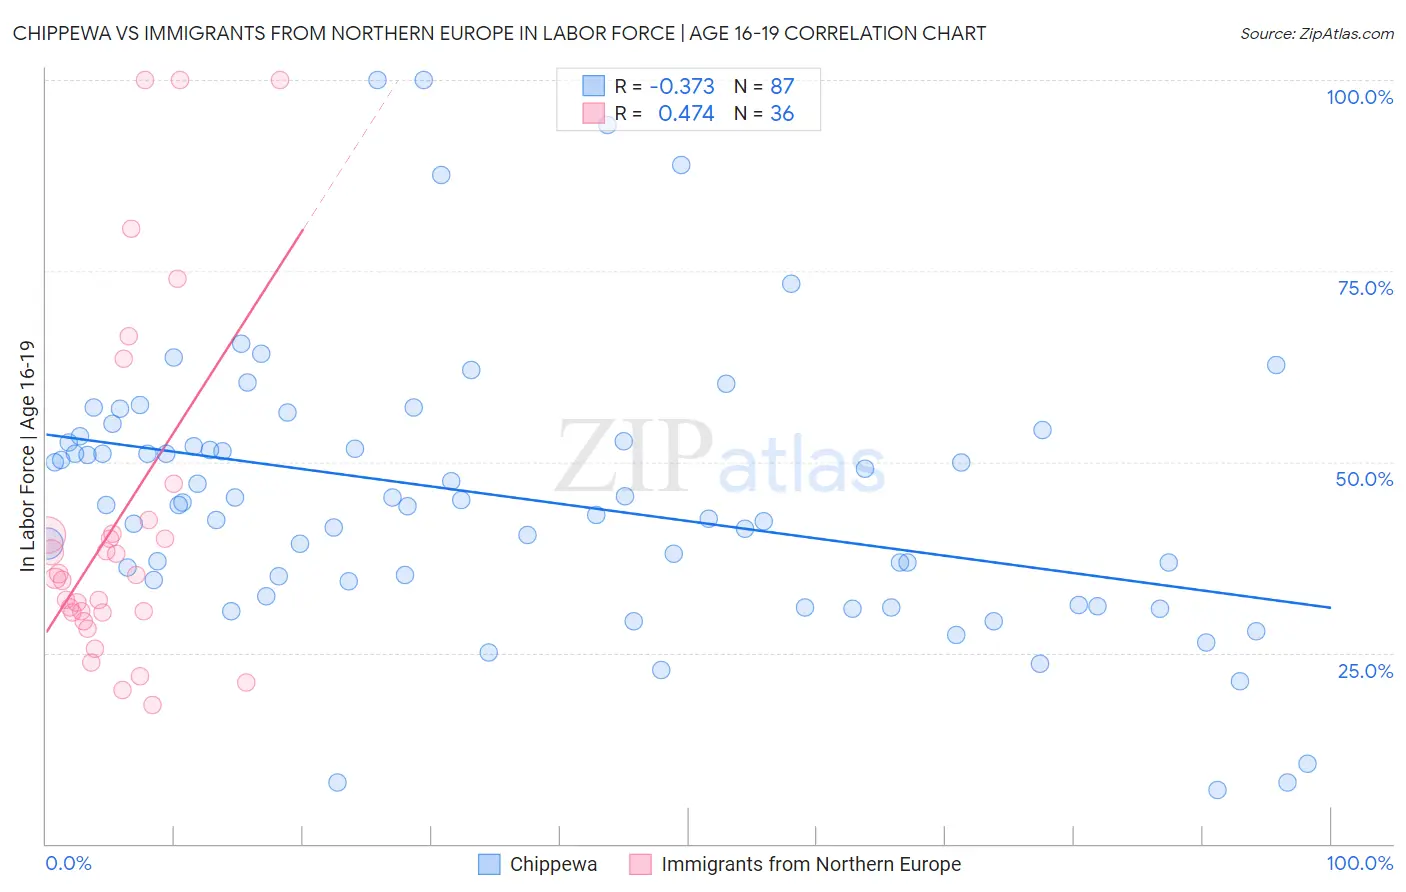
Chippewa vs Immigrants from Northern Europe In Labor Force | Age 16-19 Correlation Chart
The statistical analysis conducted on geographies consisting of 214,800,226 people shows a mild negative correlation between the proportion of Chippewa and labor force participation rate among population between the ages 16 and 19 in the United States with a correlation coefficient (R) of -0.373 and weighted average of 43.8%. Similarly, the statistical analysis conducted on geographies consisting of 475,712,736 people shows a moderate positive correlation between the proportion of Immigrants from Northern Europe and labor force participation rate among population between the ages 16 and 19 in the United States with a correlation coefficient (R) of 0.474 and weighted average of 36.5%, a difference of 20.0%.
In Labor Force | Age 16-19 Correlation Summary
| Measurement | Chippewa | Immigrants from Northern Europe |
| Minimum | 7.1% | 18.2% |
| Maximum | 100.0% | 100.0% |
| Range | 92.9% | 81.8% |
| Mean | 45.3% | 42.4% |
| Median | 44.4% | 35.0% |
| Interquartile 25% (IQ1) | 34.3% | 30.3% |
| Interquartile 75% (IQ3) | 52.7% | 41.5% |
| Interquartile Range (IQR) | 18.4% | 11.2% |
| Standard Deviation (Sample) | 18.0% | 22.5% |
| Standard Deviation (Population) | 17.9% | 22.2% |
Similar Demographics by In Labor Force | Age 16-19
Demographics Similar to Chippewa by In Labor Force | Age 16-19
In terms of in labor force | age 16-19, the demographic groups most similar to Chippewa are Dutch (43.8%, a difference of 0.10%), Slovene (43.7%, a difference of 0.26%), Finnish (43.9%, a difference of 0.29%), Czech (43.6%, a difference of 0.36%), and Scandinavian (43.6%, a difference of 0.43%).
| Demographics | Rating | Rank | In Labor Force | Age 16-19 |
| Danes | 100.0 /100 | #7 | Exceptional 44.7% |
| Immigrants | Cabo Verde | 100.0 /100 | #8 | Exceptional 44.7% |
| Cape Verdeans | 100.0 /100 | #9 | Exceptional 44.5% |
| Germans | 100.0 /100 | #10 | Exceptional 44.2% |
| Swedes | 100.0 /100 | #11 | Exceptional 44.1% |
| Finns | 100.0 /100 | #12 | Exceptional 43.9% |
| Dutch | 100.0 /100 | #13 | Exceptional 43.8% |
| Chippewa | 100.0 /100 | #14 | Exceptional 43.8% |
| Slovenes | 100.0 /100 | #15 | Exceptional 43.7% |
| Czechs | 100.0 /100 | #16 | Exceptional 43.6% |
| Scandinavians | 100.0 /100 | #17 | Exceptional 43.6% |
| French Canadians | 100.0 /100 | #18 | Exceptional 43.6% |
| Belgians | 100.0 /100 | #19 | Exceptional 43.4% |
| Swiss | 100.0 /100 | #20 | Exceptional 43.3% |
| Ottawa | 100.0 /100 | #21 | Exceptional 43.0% |
Demographics Similar to Immigrants from Northern Europe by In Labor Force | Age 16-19
In terms of in labor force | age 16-19, the demographic groups most similar to Immigrants from Northern Europe are Black/African American (36.5%, a difference of 0.080%), Albanian (36.5%, a difference of 0.11%), Native/Alaskan (36.6%, a difference of 0.12%), Immigrants from Czechoslovakia (36.6%, a difference of 0.17%), and Immigrants from Southern Europe (36.4%, a difference of 0.17%).
| Demographics | Rating | Rank | In Labor Force | Age 16-19 |
| Immigrants | South Africa | 60.5 /100 | #170 | Good 36.8% |
| Immigrants | Cambodia | 58.4 /100 | #171 | Average 36.7% |
| South Africans | 58.3 /100 | #172 | Average 36.7% |
| Russians | 57.5 /100 | #173 | Average 36.7% |
| Immigrants | Czechoslovakia | 50.0 /100 | #174 | Average 36.6% |
| Natives/Alaskans | 49.0 /100 | #175 | Average 36.6% |
| Albanians | 48.8 /100 | #176 | Average 36.5% |
| Immigrants | Northern Europe | 46.6 /100 | #177 | Average 36.5% |
| Blacks/African Americans | 45.1 /100 | #178 | Average 36.5% |
| Immigrants | Southern Europe | 43.3 /100 | #179 | Average 36.4% |
| Immigrants | Morocco | 41.1 /100 | #180 | Average 36.4% |
| Jordanians | 39.6 /100 | #181 | Fair 36.4% |
| Immigrants | Italy | 39.1 /100 | #182 | Fair 36.4% |
| Eastern Europeans | 38.8 /100 | #183 | Fair 36.4% |
| Costa Ricans | 36.1 /100 | #184 | Fair 36.3% |