Chippewa vs American In Labor Force | Age 16-19
COMPARE
Chippewa
American
In Labor Force | Age 16-19
In Labor Force | Age 16-19 Comparison
Chippewa
Americans
43.8%
IN LABOR FORCE | AGE 16-19
100.0/ 100
METRIC RATING
14th/ 347
METRIC RANK
40.3%
IN LABOR FORCE | AGE 16-19
100.0/ 100
METRIC RATING
61st/ 347
METRIC RANK
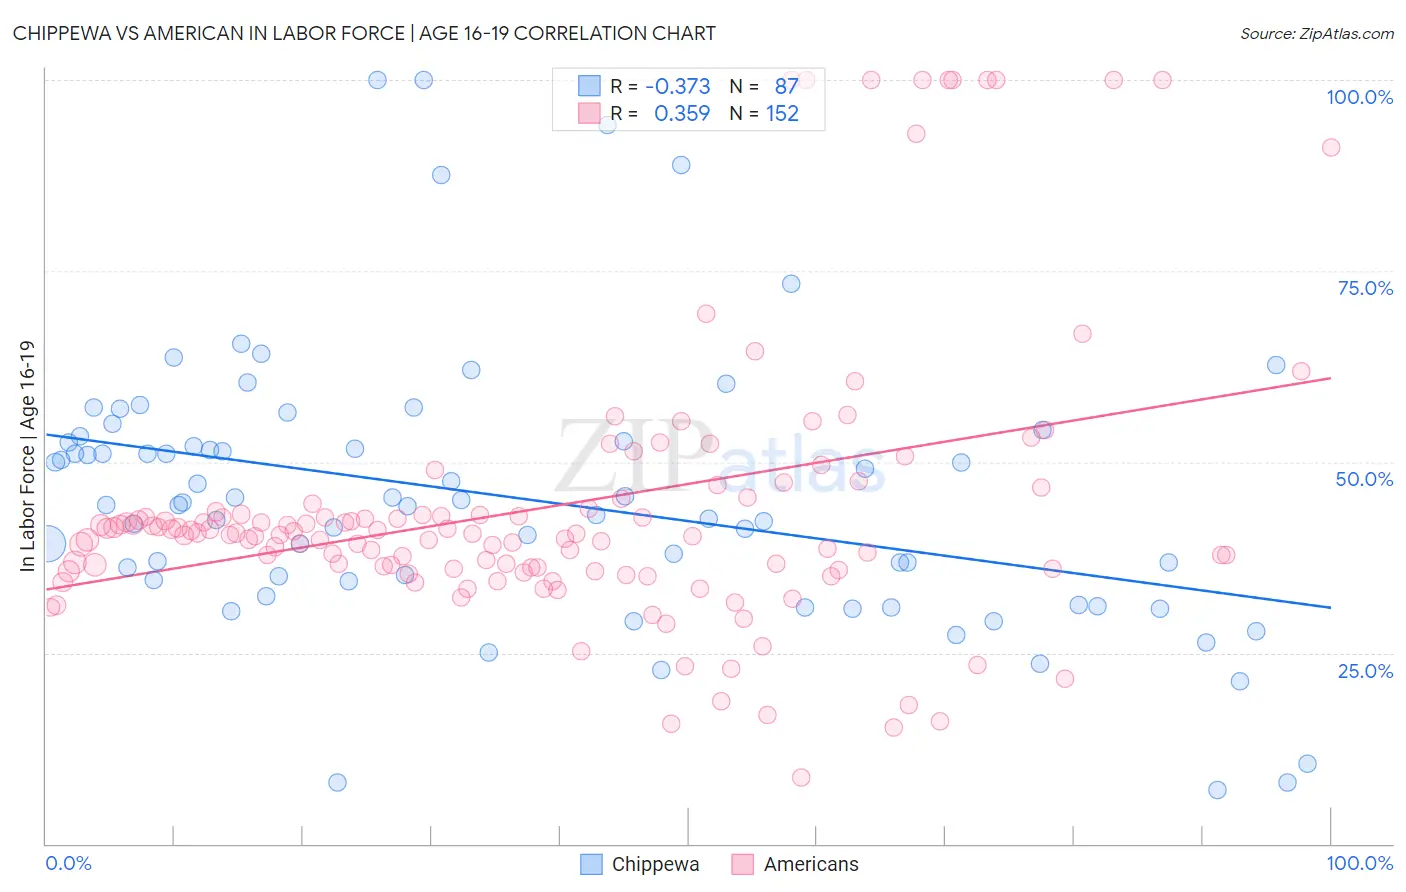
Chippewa vs American In Labor Force | Age 16-19 Correlation Chart
The statistical analysis conducted on geographies consisting of 214,800,226 people shows a mild negative correlation between the proportion of Chippewa and labor force participation rate among population between the ages 16 and 19 in the United States with a correlation coefficient (R) of -0.373 and weighted average of 43.8%. Similarly, the statistical analysis conducted on geographies consisting of 576,408,281 people shows a mild positive correlation between the proportion of Americans and labor force participation rate among population between the ages 16 and 19 in the United States with a correlation coefficient (R) of 0.359 and weighted average of 40.3%, a difference of 8.7%.
In Labor Force | Age 16-19 Correlation Summary
| Measurement | Chippewa | American |
| Minimum | 7.1% | 8.6% |
| Maximum | 100.0% | 100.0% |
| Range | 92.9% | 91.4% |
| Mean | 45.3% | 44.1% |
| Median | 44.4% | 40.6% |
| Interquartile 25% (IQ1) | 34.3% | 36.0% |
| Interquartile 75% (IQ3) | 52.7% | 43.6% |
| Interquartile Range (IQR) | 18.4% | 7.6% |
| Standard Deviation (Sample) | 18.0% | 18.5% |
| Standard Deviation (Population) | 17.9% | 18.5% |
Similar Demographics by In Labor Force | Age 16-19
Demographics Similar to Chippewa by In Labor Force | Age 16-19
In terms of in labor force | age 16-19, the demographic groups most similar to Chippewa are Dutch (43.8%, a difference of 0.10%), Slovene (43.7%, a difference of 0.26%), Finnish (43.9%, a difference of 0.29%), Czech (43.6%, a difference of 0.36%), and Scandinavian (43.6%, a difference of 0.43%).
| Demographics | Rating | Rank | In Labor Force | Age 16-19 |
| Danes | 100.0 /100 | #7 | Exceptional 44.7% |
| Immigrants | Cabo Verde | 100.0 /100 | #8 | Exceptional 44.7% |
| Cape Verdeans | 100.0 /100 | #9 | Exceptional 44.5% |
| Germans | 100.0 /100 | #10 | Exceptional 44.2% |
| Swedes | 100.0 /100 | #11 | Exceptional 44.1% |
| Finns | 100.0 /100 | #12 | Exceptional 43.9% |
| Dutch | 100.0 /100 | #13 | Exceptional 43.8% |
| Chippewa | 100.0 /100 | #14 | Exceptional 43.8% |
| Slovenes | 100.0 /100 | #15 | Exceptional 43.7% |
| Czechs | 100.0 /100 | #16 | Exceptional 43.6% |
| Scandinavians | 100.0 /100 | #17 | Exceptional 43.6% |
| French Canadians | 100.0 /100 | #18 | Exceptional 43.6% |
| Belgians | 100.0 /100 | #19 | Exceptional 43.4% |
| Swiss | 100.0 /100 | #20 | Exceptional 43.3% |
| Ottawa | 100.0 /100 | #21 | Exceptional 43.0% |
Demographics Similar to Americans by In Labor Force | Age 16-19
In terms of in labor force | age 16-19, the demographic groups most similar to Americans are Cherokee (40.2%, a difference of 0.14%), Immigrants from Eastern Africa (40.4%, a difference of 0.15%), Slavic (40.4%, a difference of 0.19%), Northern European (40.2%, a difference of 0.20%), and Immigrants from Micronesia (40.2%, a difference of 0.31%).
| Demographics | Rating | Rank | In Labor Force | Age 16-19 |
| Tlingit-Haida | 100.0 /100 | #54 | Exceptional 40.5% |
| British | 100.0 /100 | #55 | Exceptional 40.5% |
| Fijians | 100.0 /100 | #56 | Exceptional 40.4% |
| Lithuanians | 100.0 /100 | #57 | Exceptional 40.4% |
| Aleuts | 100.0 /100 | #58 | Exceptional 40.4% |
| Slavs | 100.0 /100 | #59 | Exceptional 40.4% |
| Immigrants | Eastern Africa | 100.0 /100 | #60 | Exceptional 40.4% |
| Americans | 100.0 /100 | #61 | Exceptional 40.3% |
| Cherokee | 100.0 /100 | #62 | Exceptional 40.2% |
| Northern Europeans | 100.0 /100 | #63 | Exceptional 40.2% |
| Immigrants | Micronesia | 100.0 /100 | #64 | Exceptional 40.2% |
| Kenyans | 100.0 /100 | #65 | Exceptional 40.1% |
| Immigrants | Nonimmigrants | 100.0 /100 | #66 | Exceptional 40.1% |
| Canadians | 100.0 /100 | #67 | Exceptional 40.1% |
| Italians | 99.9 /100 | #68 | Exceptional 40.1% |