Chippewa vs Immigrants from Venezuela In Labor Force | Age 16-19
COMPARE
Chippewa
Immigrants from Venezuela
In Labor Force | Age 16-19
In Labor Force | Age 16-19 Comparison
Chippewa
Immigrants from Venezuela
43.8%
IN LABOR FORCE | AGE 16-19
100.0/ 100
METRIC RATING
14th/ 347
METRIC RANK
33.7%
IN LABOR FORCE | AGE 16-19
0.2/ 100
METRIC RATING
283rd/ 347
METRIC RANK
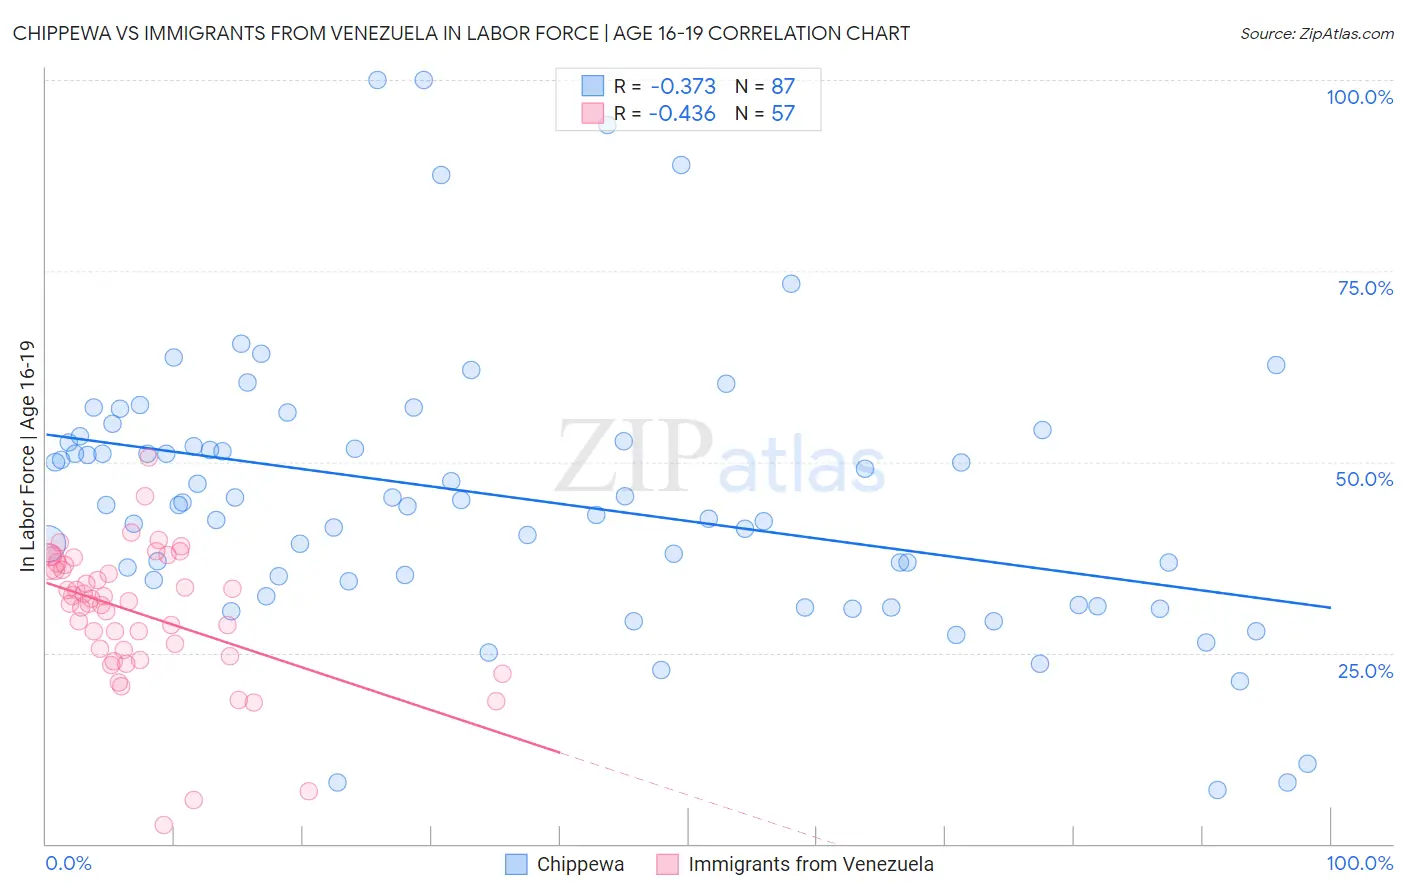
Chippewa vs Immigrants from Venezuela In Labor Force | Age 16-19 Correlation Chart
The statistical analysis conducted on geographies consisting of 214,800,226 people shows a mild negative correlation between the proportion of Chippewa and labor force participation rate among population between the ages 16 and 19 in the United States with a correlation coefficient (R) of -0.373 and weighted average of 43.8%. Similarly, the statistical analysis conducted on geographies consisting of 287,600,436 people shows a moderate negative correlation between the proportion of Immigrants from Venezuela and labor force participation rate among population between the ages 16 and 19 in the United States with a correlation coefficient (R) of -0.436 and weighted average of 33.7%, a difference of 30.0%.
In Labor Force | Age 16-19 Correlation Summary
| Measurement | Chippewa | Immigrants from Venezuela |
| Minimum | 7.1% | 2.4% |
| Maximum | 100.0% | 50.5% |
| Range | 92.9% | 48.1% |
| Mean | 45.3% | 30.2% |
| Median | 44.4% | 31.7% |
| Interquartile 25% (IQ1) | 34.3% | 25.0% |
| Interquartile 75% (IQ3) | 52.7% | 36.7% |
| Interquartile Range (IQR) | 18.4% | 11.7% |
| Standard Deviation (Sample) | 18.0% | 9.0% |
| Standard Deviation (Population) | 17.9% | 8.9% |
Similar Demographics by In Labor Force | Age 16-19
Demographics Similar to Chippewa by In Labor Force | Age 16-19
In terms of in labor force | age 16-19, the demographic groups most similar to Chippewa are Dutch (43.8%, a difference of 0.10%), Slovene (43.7%, a difference of 0.26%), Finnish (43.9%, a difference of 0.29%), Czech (43.6%, a difference of 0.36%), and Scandinavian (43.6%, a difference of 0.43%).
| Demographics | Rating | Rank | In Labor Force | Age 16-19 |
| Danes | 100.0 /100 | #7 | Exceptional 44.7% |
| Immigrants | Cabo Verde | 100.0 /100 | #8 | Exceptional 44.7% |
| Cape Verdeans | 100.0 /100 | #9 | Exceptional 44.5% |
| Germans | 100.0 /100 | #10 | Exceptional 44.2% |
| Swedes | 100.0 /100 | #11 | Exceptional 44.1% |
| Finns | 100.0 /100 | #12 | Exceptional 43.9% |
| Dutch | 100.0 /100 | #13 | Exceptional 43.8% |
| Chippewa | 100.0 /100 | #14 | Exceptional 43.8% |
| Slovenes | 100.0 /100 | #15 | Exceptional 43.7% |
| Czechs | 100.0 /100 | #16 | Exceptional 43.6% |
| Scandinavians | 100.0 /100 | #17 | Exceptional 43.6% |
| French Canadians | 100.0 /100 | #18 | Exceptional 43.6% |
| Belgians | 100.0 /100 | #19 | Exceptional 43.4% |
| Swiss | 100.0 /100 | #20 | Exceptional 43.3% |
| Ottawa | 100.0 /100 | #21 | Exceptional 43.0% |
Demographics Similar to Immigrants from Venezuela by In Labor Force | Age 16-19
In terms of in labor force | age 16-19, the demographic groups most similar to Immigrants from Venezuela are Immigrants from Spain (33.7%, a difference of 0.060%), U.S. Virgin Islander (33.6%, a difference of 0.25%), South American (33.6%, a difference of 0.34%), Immigrants from Korea (33.8%, a difference of 0.35%), and Cypriot (33.8%, a difference of 0.36%).
| Demographics | Rating | Rank | In Labor Force | Age 16-19 |
| Immigrants | Latin America | 0.3 /100 | #276 | Tragic 33.9% |
| Menominee | 0.3 /100 | #277 | Tragic 33.9% |
| Colombians | 0.3 /100 | #278 | Tragic 33.8% |
| Paraguayans | 0.3 /100 | #279 | Tragic 33.8% |
| Taiwanese | 0.3 /100 | #280 | Tragic 33.8% |
| Cypriots | 0.3 /100 | #281 | Tragic 33.8% |
| Immigrants | Korea | 0.3 /100 | #282 | Tragic 33.8% |
| Immigrants | Venezuela | 0.2 /100 | #283 | Tragic 33.7% |
| Immigrants | Spain | 0.2 /100 | #284 | Tragic 33.7% |
| U.S. Virgin Islanders | 0.2 /100 | #285 | Tragic 33.6% |
| South Americans | 0.2 /100 | #286 | Tragic 33.6% |
| Nepalese | 0.1 /100 | #287 | Tragic 33.5% |
| Immigrants | Indonesia | 0.1 /100 | #288 | Tragic 33.5% |
| Immigrants | Singapore | 0.1 /100 | #289 | Tragic 33.5% |
| Immigrants | Colombia | 0.1 /100 | #290 | Tragic 33.5% |