Comanche vs Maltese In Labor Force | Age 16-19
COMPARE
Comanche
Maltese
In Labor Force | Age 16-19
In Labor Force | Age 16-19 Comparison
Comanche
Maltese
37.7%
IN LABOR FORCE | AGE 16-19
91.9/ 100
METRIC RATING
138th/ 347
METRIC RANK
38.5%
IN LABOR FORCE | AGE 16-19
98.6/ 100
METRIC RATING
110th/ 347
METRIC RANK
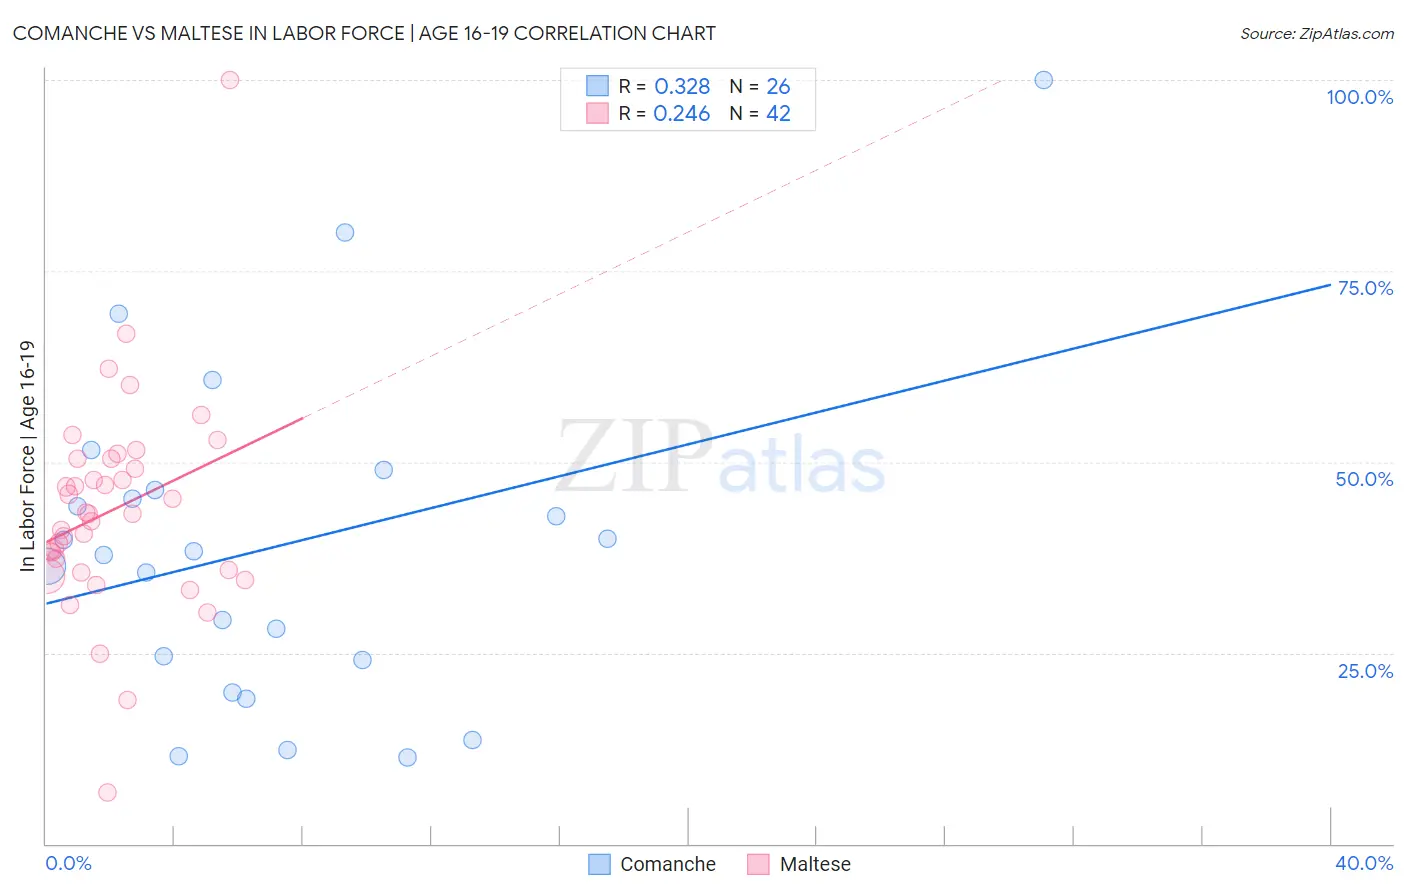
Comanche vs Maltese In Labor Force | Age 16-19 Correlation Chart
The statistical analysis conducted on geographies consisting of 109,736,088 people shows a mild positive correlation between the proportion of Comanche and labor force participation rate among population between the ages 16 and 19 in the United States with a correlation coefficient (R) of 0.328 and weighted average of 37.7%. Similarly, the statistical analysis conducted on geographies consisting of 126,398,157 people shows a weak positive correlation between the proportion of Maltese and labor force participation rate among population between the ages 16 and 19 in the United States with a correlation coefficient (R) of 0.246 and weighted average of 38.5%, a difference of 2.2%.
In Labor Force | Age 16-19 Correlation Summary
| Measurement | Comanche | Maltese |
| Minimum | 11.3% | 6.7% |
| Maximum | 100.0% | 100.0% |
| Range | 88.7% | 93.3% |
| Mean | 38.8% | 43.7% |
| Median | 38.0% | 43.2% |
| Interquartile 25% (IQ1) | 24.0% | 35.9% |
| Interquartile 75% (IQ3) | 46.3% | 50.4% |
| Interquartile Range (IQR) | 22.3% | 14.5% |
| Standard Deviation (Sample) | 21.5% | 14.2% |
| Standard Deviation (Population) | 21.1% | 14.1% |
Similar Demographics by In Labor Force | Age 16-19
Demographics Similar to Comanche by In Labor Force | Age 16-19
In terms of in labor force | age 16-19, the demographic groups most similar to Comanche are Immigrants from Moldova (37.7%, a difference of 0.010%), Estonian (37.7%, a difference of 0.050%), Syrian (37.6%, a difference of 0.19%), Australian (37.8%, a difference of 0.23%), and Cajun (37.8%, a difference of 0.23%).
| Demographics | Rating | Rank | In Labor Force | Age 16-19 |
| Immigrants | Austria | 95.0 /100 | #131 | Exceptional 37.9% |
| Immigrants | Oceania | 94.7 /100 | #132 | Exceptional 37.9% |
| Cheyenne | 94.6 /100 | #133 | Exceptional 37.9% |
| Immigrants | Netherlands | 93.7 /100 | #134 | Exceptional 37.8% |
| Macedonians | 93.4 /100 | #135 | Exceptional 37.8% |
| Australians | 93.2 /100 | #136 | Exceptional 37.8% |
| Cajuns | 93.2 /100 | #137 | Exceptional 37.8% |
| Comanche | 91.9 /100 | #138 | Exceptional 37.7% |
| Immigrants | Moldova | 91.9 /100 | #139 | Exceptional 37.7% |
| Estonians | 91.7 /100 | #140 | Exceptional 37.7% |
| Syrians | 90.7 /100 | #141 | Exceptional 37.6% |
| Sierra Leoneans | 89.7 /100 | #142 | Excellent 37.6% |
| Pakistanis | 89.5 /100 | #143 | Excellent 37.6% |
| Japanese | 89.3 /100 | #144 | Excellent 37.5% |
| Paiute | 89.3 /100 | #145 | Excellent 37.5% |
Demographics Similar to Maltese by In Labor Force | Age 16-19
In terms of in labor force | age 16-19, the demographic groups most similar to Maltese are Crow (38.5%, a difference of 0.060%), Immigrants from Scotland (38.5%, a difference of 0.070%), Immigrants from Ethiopia (38.6%, a difference of 0.12%), Lebanese (38.6%, a difference of 0.12%), and Subsaharan African (38.4%, a difference of 0.20%).
| Demographics | Rating | Rank | In Labor Force | Age 16-19 |
| Immigrants | Cameroon | 99.0 /100 | #103 | Exceptional 38.7% |
| Immigrants | Eritrea | 99.0 /100 | #104 | Exceptional 38.7% |
| Iraqis | 98.9 /100 | #105 | Exceptional 38.6% |
| Delaware | 98.8 /100 | #106 | Exceptional 38.6% |
| Chinese | 98.8 /100 | #107 | Exceptional 38.6% |
| Immigrants | Ethiopia | 98.7 /100 | #108 | Exceptional 38.6% |
| Lebanese | 98.7 /100 | #109 | Exceptional 38.6% |
| Maltese | 98.6 /100 | #110 | Exceptional 38.5% |
| Crow | 98.5 /100 | #111 | Exceptional 38.5% |
| Immigrants | Scotland | 98.5 /100 | #112 | Exceptional 38.5% |
| Sub-Saharan Africans | 98.3 /100 | #113 | Exceptional 38.4% |
| Hawaiians | 98.2 /100 | #114 | Exceptional 38.4% |
| Bulgarians | 97.9 /100 | #115 | Exceptional 38.3% |
| Colville | 97.9 /100 | #116 | Exceptional 38.3% |
| Chickasaw | 97.8 /100 | #117 | Exceptional 38.3% |