Chippewa vs Choctaw In Labor Force | Age 16-19
COMPARE
Chippewa
Choctaw
In Labor Force | Age 16-19
In Labor Force | Age 16-19 Comparison
Chippewa
Choctaw
43.8%
IN LABOR FORCE | AGE 16-19
100.0/ 100
METRIC RATING
14th/ 347
METRIC RANK
38.0%
IN LABOR FORCE | AGE 16-19
95.6/ 100
METRIC RATING
127th/ 347
METRIC RANK
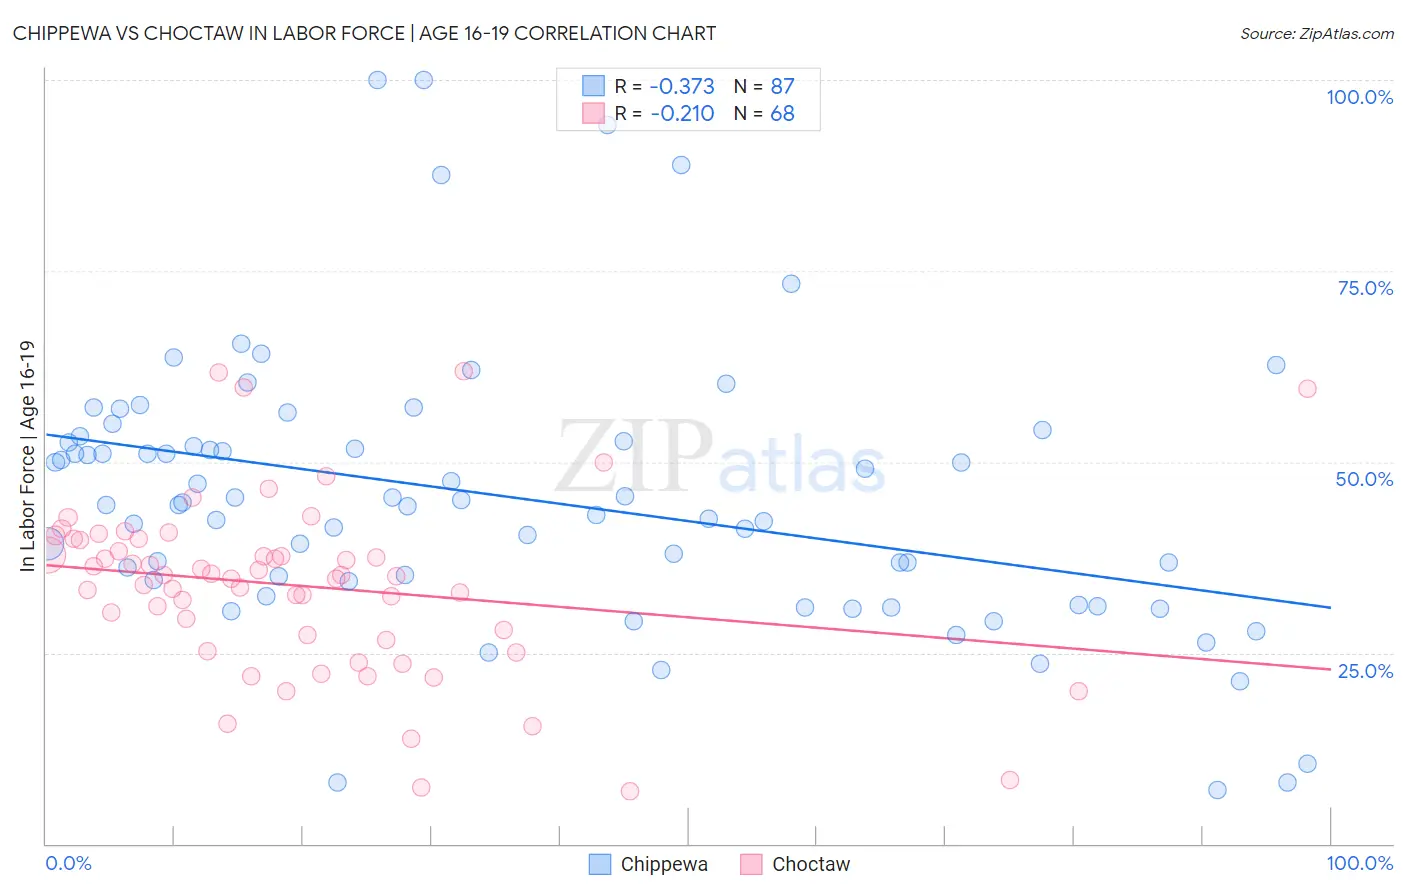
Chippewa vs Choctaw In Labor Force | Age 16-19 Correlation Chart
The statistical analysis conducted on geographies consisting of 214,800,226 people shows a mild negative correlation between the proportion of Chippewa and labor force participation rate among population between the ages 16 and 19 in the United States with a correlation coefficient (R) of -0.373 and weighted average of 43.8%. Similarly, the statistical analysis conducted on geographies consisting of 269,371,385 people shows a weak negative correlation between the proportion of Choctaw and labor force participation rate among population between the ages 16 and 19 in the United States with a correlation coefficient (R) of -0.210 and weighted average of 38.0%, a difference of 15.3%.
In Labor Force | Age 16-19 Correlation Summary
| Measurement | Chippewa | Choctaw |
| Minimum | 7.1% | 6.9% |
| Maximum | 100.0% | 61.9% |
| Range | 92.9% | 55.0% |
| Mean | 45.3% | 33.8% |
| Median | 44.4% | 35.1% |
| Interquartile 25% (IQ1) | 34.3% | 27.0% |
| Interquartile 75% (IQ3) | 52.7% | 39.9% |
| Interquartile Range (IQR) | 18.4% | 12.8% |
| Standard Deviation (Sample) | 18.0% | 11.5% |
| Standard Deviation (Population) | 17.9% | 11.5% |
Similar Demographics by In Labor Force | Age 16-19
Demographics Similar to Chippewa by In Labor Force | Age 16-19
In terms of in labor force | age 16-19, the demographic groups most similar to Chippewa are Dutch (43.8%, a difference of 0.10%), Slovene (43.7%, a difference of 0.26%), Finnish (43.9%, a difference of 0.29%), Czech (43.6%, a difference of 0.36%), and Scandinavian (43.6%, a difference of 0.43%).
| Demographics | Rating | Rank | In Labor Force | Age 16-19 |
| Danes | 100.0 /100 | #7 | Exceptional 44.7% |
| Immigrants | Cabo Verde | 100.0 /100 | #8 | Exceptional 44.7% |
| Cape Verdeans | 100.0 /100 | #9 | Exceptional 44.5% |
| Germans | 100.0 /100 | #10 | Exceptional 44.2% |
| Swedes | 100.0 /100 | #11 | Exceptional 44.1% |
| Finns | 100.0 /100 | #12 | Exceptional 43.9% |
| Dutch | 100.0 /100 | #13 | Exceptional 43.8% |
| Chippewa | 100.0 /100 | #14 | Exceptional 43.8% |
| Slovenes | 100.0 /100 | #15 | Exceptional 43.7% |
| Czechs | 100.0 /100 | #16 | Exceptional 43.6% |
| Scandinavians | 100.0 /100 | #17 | Exceptional 43.6% |
| French Canadians | 100.0 /100 | #18 | Exceptional 43.6% |
| Belgians | 100.0 /100 | #19 | Exceptional 43.4% |
| Swiss | 100.0 /100 | #20 | Exceptional 43.3% |
| Ottawa | 100.0 /100 | #21 | Exceptional 43.0% |
Demographics Similar to Choctaw by In Labor Force | Age 16-19
In terms of in labor force | age 16-19, the demographic groups most similar to Choctaw are New Zealander (38.0%, a difference of 0.0%), African (38.0%, a difference of 0.010%), Spaniard (38.0%, a difference of 0.030%), Immigrants from Zimbabwe (38.0%, a difference of 0.060%), and Immigrants from Austria (37.9%, a difference of 0.15%).
| Demographics | Rating | Rank | In Labor Force | Age 16-19 |
| Ukrainians | 97.6 /100 | #120 | Exceptional 38.3% |
| Ethiopians | 97.4 /100 | #121 | Exceptional 38.2% |
| Guamanians/Chamorros | 97.4 /100 | #122 | Exceptional 38.2% |
| Seminole | 96.7 /100 | #123 | Exceptional 38.1% |
| Immigrants | England | 96.4 /100 | #124 | Exceptional 38.1% |
| Immigrants | Africa | 96.1 /100 | #125 | Exceptional 38.0% |
| Africans | 95.6 /100 | #126 | Exceptional 38.0% |
| Choctaw | 95.6 /100 | #127 | Exceptional 38.0% |
| New Zealanders | 95.6 /100 | #128 | Exceptional 38.0% |
| Spaniards | 95.5 /100 | #129 | Exceptional 38.0% |
| Immigrants | Zimbabwe | 95.4 /100 | #130 | Exceptional 38.0% |
| Immigrants | Austria | 95.0 /100 | #131 | Exceptional 37.9% |
| Immigrants | Oceania | 94.7 /100 | #132 | Exceptional 37.9% |
| Cheyenne | 94.6 /100 | #133 | Exceptional 37.9% |
| Immigrants | Netherlands | 93.7 /100 | #134 | Exceptional 37.8% |