Pakistani vs Maltese In Labor Force | Age 16-19
COMPARE
Pakistani
Maltese
In Labor Force | Age 16-19
In Labor Force | Age 16-19 Comparison
Pakistanis
Maltese
37.6%
IN LABOR FORCE | AGE 16-19
89.5/ 100
METRIC RATING
143rd/ 347
METRIC RANK
38.5%
IN LABOR FORCE | AGE 16-19
98.6/ 100
METRIC RATING
110th/ 347
METRIC RANK
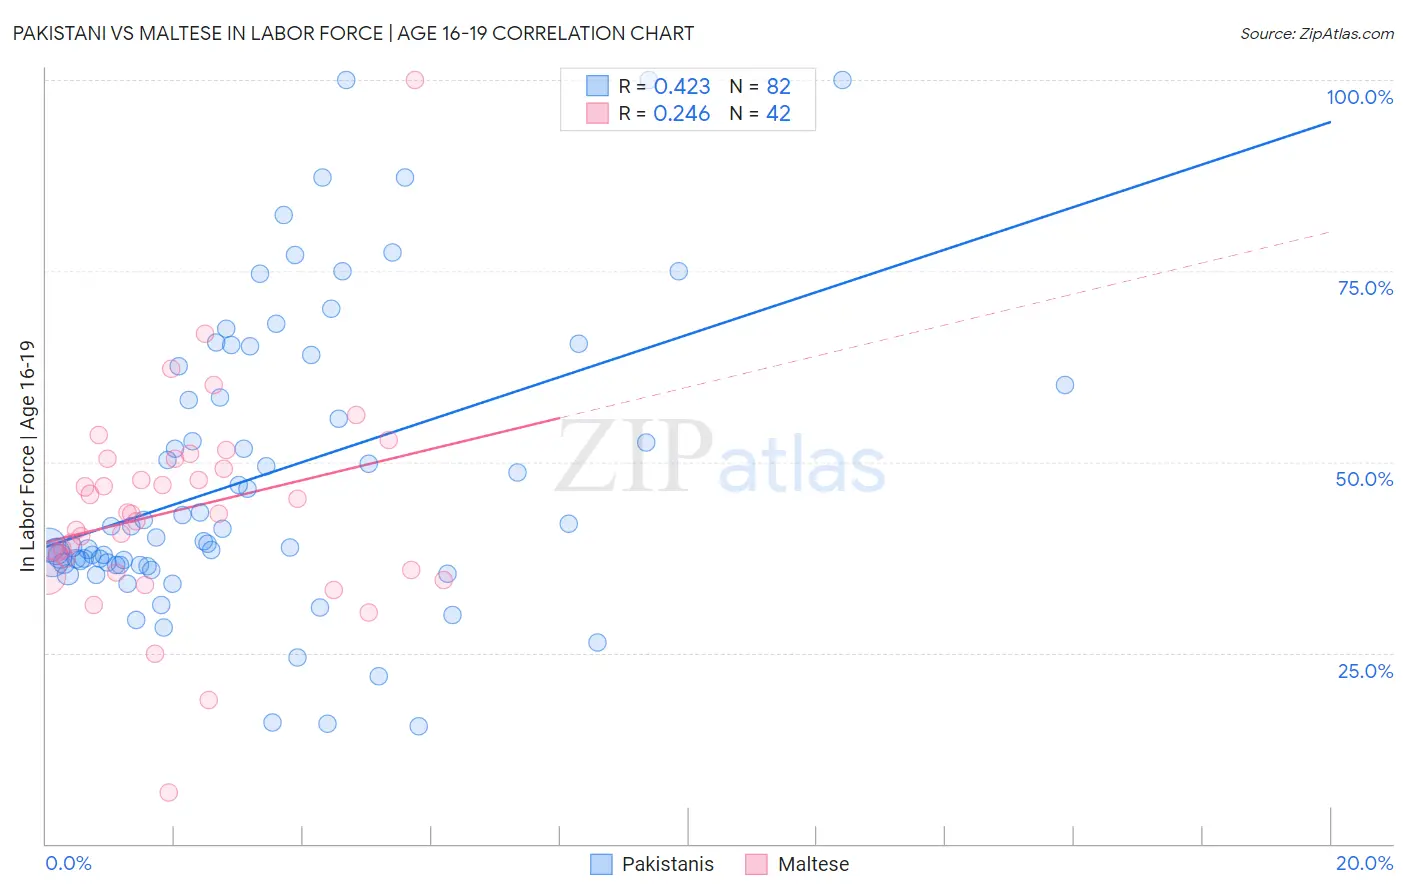
Pakistani vs Maltese In Labor Force | Age 16-19 Correlation Chart
The statistical analysis conducted on geographies consisting of 335,000,628 people shows a moderate positive correlation between the proportion of Pakistanis and labor force participation rate among population between the ages 16 and 19 in the United States with a correlation coefficient (R) of 0.423 and weighted average of 37.6%. Similarly, the statistical analysis conducted on geographies consisting of 126,398,157 people shows a weak positive correlation between the proportion of Maltese and labor force participation rate among population between the ages 16 and 19 in the United States with a correlation coefficient (R) of 0.246 and weighted average of 38.5%, a difference of 2.6%.
In Labor Force | Age 16-19 Correlation Summary
| Measurement | Pakistani | Maltese |
| Minimum | 15.4% | 6.7% |
| Maximum | 100.0% | 100.0% |
| Range | 84.6% | 93.3% |
| Mean | 48.1% | 43.7% |
| Median | 40.7% | 43.2% |
| Interquartile 25% (IQ1) | 36.5% | 35.9% |
| Interquartile 75% (IQ3) | 60.0% | 50.4% |
| Interquartile Range (IQR) | 23.5% | 14.5% |
| Standard Deviation (Sample) | 19.2% | 14.2% |
| Standard Deviation (Population) | 19.1% | 14.1% |
Similar Demographics by In Labor Force | Age 16-19
Demographics Similar to Pakistanis by In Labor Force | Age 16-19
In terms of in labor force | age 16-19, the demographic groups most similar to Pakistanis are Japanese (37.5%, a difference of 0.020%), Paiute (37.5%, a difference of 0.020%), Sierra Leonean (37.6%, a difference of 0.030%), Immigrants from Western Europe (37.5%, a difference of 0.070%), and Brazilian (37.5%, a difference of 0.10%).
| Demographics | Rating | Rank | In Labor Force | Age 16-19 |
| Australians | 93.2 /100 | #136 | Exceptional 37.8% |
| Cajuns | 93.2 /100 | #137 | Exceptional 37.8% |
| Comanche | 91.9 /100 | #138 | Exceptional 37.7% |
| Immigrants | Moldova | 91.9 /100 | #139 | Exceptional 37.7% |
| Estonians | 91.7 /100 | #140 | Exceptional 37.7% |
| Syrians | 90.7 /100 | #141 | Exceptional 37.6% |
| Sierra Leoneans | 89.7 /100 | #142 | Excellent 37.6% |
| Pakistanis | 89.5 /100 | #143 | Excellent 37.6% |
| Japanese | 89.3 /100 | #144 | Excellent 37.5% |
| Paiute | 89.3 /100 | #145 | Excellent 37.5% |
| Immigrants | Western Europe | 88.9 /100 | #146 | Excellent 37.5% |
| Brazilians | 88.7 /100 | #147 | Excellent 37.5% |
| Romanians | 87.3 /100 | #148 | Excellent 37.5% |
| Native Hawaiians | 85.0 /100 | #149 | Excellent 37.4% |
| Tsimshian | 84.7 /100 | #150 | Excellent 37.4% |
Demographics Similar to Maltese by In Labor Force | Age 16-19
In terms of in labor force | age 16-19, the demographic groups most similar to Maltese are Crow (38.5%, a difference of 0.060%), Immigrants from Scotland (38.5%, a difference of 0.070%), Immigrants from Ethiopia (38.6%, a difference of 0.12%), Lebanese (38.6%, a difference of 0.12%), and Subsaharan African (38.4%, a difference of 0.20%).
| Demographics | Rating | Rank | In Labor Force | Age 16-19 |
| Immigrants | Cameroon | 99.0 /100 | #103 | Exceptional 38.7% |
| Immigrants | Eritrea | 99.0 /100 | #104 | Exceptional 38.7% |
| Iraqis | 98.9 /100 | #105 | Exceptional 38.6% |
| Delaware | 98.8 /100 | #106 | Exceptional 38.6% |
| Chinese | 98.8 /100 | #107 | Exceptional 38.6% |
| Immigrants | Ethiopia | 98.7 /100 | #108 | Exceptional 38.6% |
| Lebanese | 98.7 /100 | #109 | Exceptional 38.6% |
| Maltese | 98.6 /100 | #110 | Exceptional 38.5% |
| Crow | 98.5 /100 | #111 | Exceptional 38.5% |
| Immigrants | Scotland | 98.5 /100 | #112 | Exceptional 38.5% |
| Sub-Saharan Africans | 98.3 /100 | #113 | Exceptional 38.4% |
| Hawaiians | 98.2 /100 | #114 | Exceptional 38.4% |
| Bulgarians | 97.9 /100 | #115 | Exceptional 38.3% |
| Colville | 97.9 /100 | #116 | Exceptional 38.3% |
| Chickasaw | 97.8 /100 | #117 | Exceptional 38.3% |