Arab vs Turkish In Labor Force | Age 25-29
COMPARE
Arab
Turkish
In Labor Force | Age 25-29
In Labor Force | Age 25-29 Comparison
Arabs
Turks
84.2%
IN LABOR FORCE | AGE 25-29
6.8/ 100
METRIC RATING
221st/ 347
METRIC RANK
85.6%
IN LABOR FORCE | AGE 25-29
99.8/ 100
METRIC RATING
47th/ 347
METRIC RANK
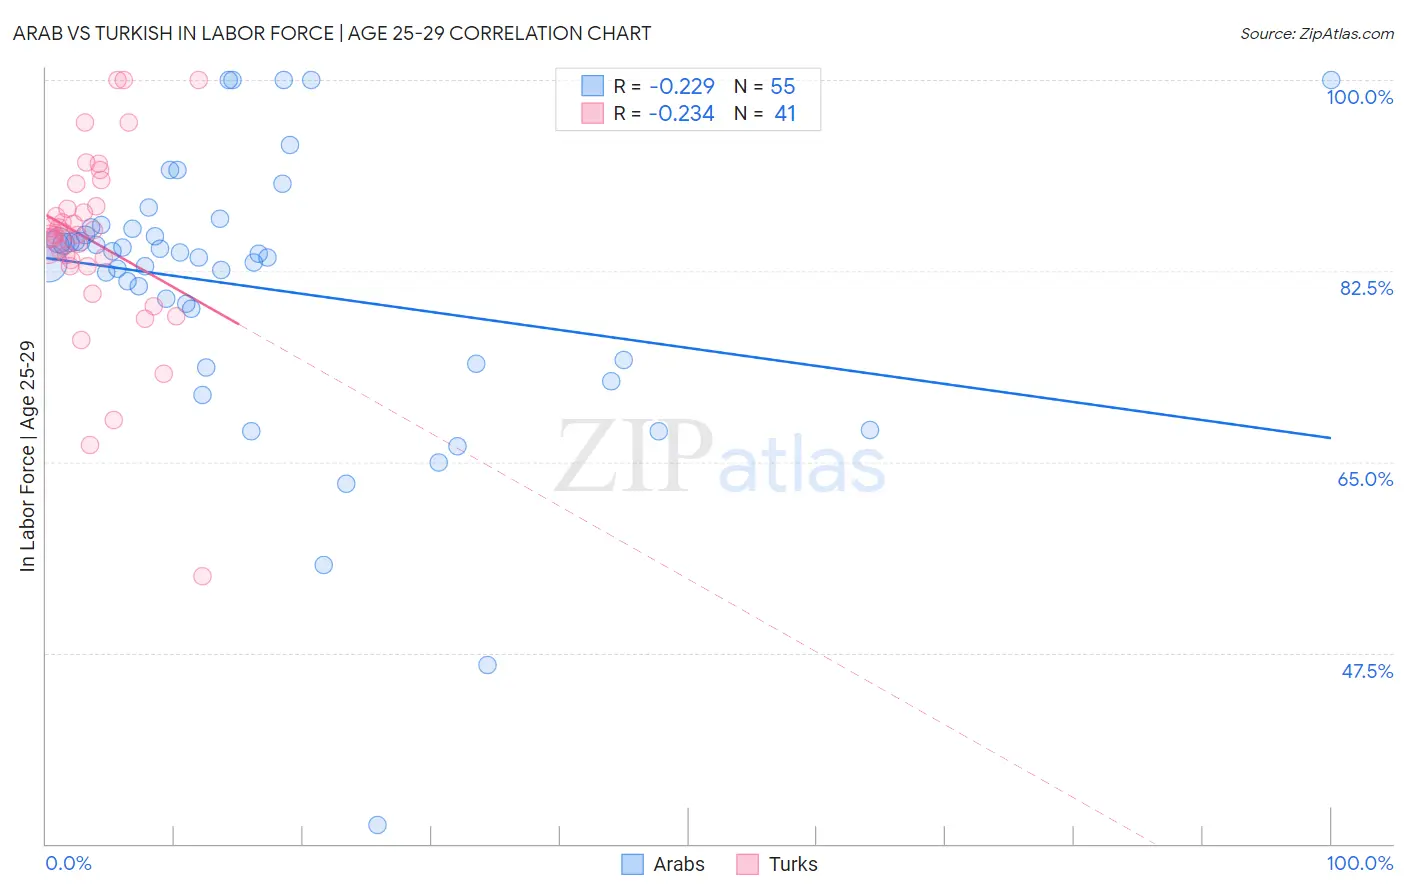
Arab vs Turkish In Labor Force | Age 25-29 Correlation Chart
The statistical analysis conducted on geographies consisting of 486,557,270 people shows a weak negative correlation between the proportion of Arabs and labor force participation rate among population between the ages 25 and 29 in the United States with a correlation coefficient (R) of -0.229 and weighted average of 84.2%. Similarly, the statistical analysis conducted on geographies consisting of 271,804,418 people shows a weak negative correlation between the proportion of Turks and labor force participation rate among population between the ages 25 and 29 in the United States with a correlation coefficient (R) of -0.234 and weighted average of 85.6%, a difference of 1.6%.
In Labor Force | Age 25-29 Correlation Summary
| Measurement | Arab | Turkish |
| Minimum | 31.7% | 54.5% |
| Maximum | 100.0% | 100.0% |
| Range | 68.3% | 45.5% |
| Mean | 81.0% | 85.1% |
| Median | 84.1% | 85.8% |
| Interquartile 25% (IQ1) | 74.3% | 82.9% |
| Interquartile 75% (IQ3) | 86.4% | 89.5% |
| Interquartile Range (IQR) | 12.1% | 6.5% |
| Standard Deviation (Sample) | 12.7% | 8.8% |
| Standard Deviation (Population) | 12.5% | 8.7% |
Similar Demographics by In Labor Force | Age 25-29
Demographics Similar to Arabs by In Labor Force | Age 25-29
In terms of in labor force | age 25-29, the demographic groups most similar to Arabs are Jordanian (84.2%, a difference of 0.0%), Nigerian (84.3%, a difference of 0.010%), Scotch-Irish (84.2%, a difference of 0.010%), Immigrants from West Indies (84.2%, a difference of 0.020%), and Korean (84.2%, a difference of 0.030%).
| Demographics | Rating | Rank | In Labor Force | Age 25-29 |
| Lebanese | 11.1 /100 | #214 | Poor 84.3% |
| Immigrants | Syria | 10.7 /100 | #215 | Poor 84.3% |
| Israelis | 9.3 /100 | #216 | Tragic 84.3% |
| Immigrants | Ecuador | 9.3 /100 | #217 | Tragic 84.3% |
| Immigrants | Nigeria | 9.0 /100 | #218 | Tragic 84.3% |
| Immigrants | Saudi Arabia | 8.8 /100 | #219 | Tragic 84.3% |
| Nigerians | 7.2 /100 | #220 | Tragic 84.3% |
| Arabs | 6.8 /100 | #221 | Tragic 84.2% |
| Jordanians | 6.7 /100 | #222 | Tragic 84.2% |
| Scotch-Irish | 6.5 /100 | #223 | Tragic 84.2% |
| Immigrants | West Indies | 6.0 /100 | #224 | Tragic 84.2% |
| Koreans | 5.9 /100 | #225 | Tragic 84.2% |
| Immigrants | Congo | 5.8 /100 | #226 | Tragic 84.2% |
| French American Indians | 5.5 /100 | #227 | Tragic 84.2% |
| Immigrants | Panama | 5.5 /100 | #228 | Tragic 84.2% |
Demographics Similar to Turks by In Labor Force | Age 25-29
In terms of in labor force | age 25-29, the demographic groups most similar to Turks are Italian (85.6%, a difference of 0.0%), Czech (85.6%, a difference of 0.020%), Swedish (85.6%, a difference of 0.020%), Yugoslavian (85.6%, a difference of 0.040%), and Immigrants from Latvia (85.6%, a difference of 0.050%).
| Demographics | Rating | Rank | In Labor Force | Age 25-29 |
| Immigrants | Albania | 99.9 /100 | #40 | Exceptional 85.7% |
| Immigrants | Greece | 99.9 /100 | #41 | Exceptional 85.7% |
| Immigrants | Eritrea | 99.9 /100 | #42 | Exceptional 85.7% |
| Immigrants | India | 99.9 /100 | #43 | Exceptional 85.7% |
| Macedonians | 99.9 /100 | #44 | Exceptional 85.7% |
| Immigrants | Sierra Leone | 99.9 /100 | #45 | Exceptional 85.7% |
| Czechs | 99.8 /100 | #46 | Exceptional 85.6% |
| Turks | 99.8 /100 | #47 | Exceptional 85.6% |
| Italians | 99.8 /100 | #48 | Exceptional 85.6% |
| Swedes | 99.8 /100 | #49 | Exceptional 85.6% |
| Yugoslavians | 99.8 /100 | #50 | Exceptional 85.6% |
| Immigrants | Latvia | 99.8 /100 | #51 | Exceptional 85.6% |
| Immigrants | Poland | 99.7 /100 | #52 | Exceptional 85.6% |
| Belgians | 99.7 /100 | #53 | Exceptional 85.5% |
| Albanians | 99.7 /100 | #54 | Exceptional 85.5% |