African vs Turkish In Labor Force | Age 25-29
COMPARE
African
Turkish
In Labor Force | Age 25-29
In Labor Force | Age 25-29 Comparison
Africans
Turks
83.2%
IN LABOR FORCE | AGE 25-29
0.0/ 100
METRIC RATING
277th/ 347
METRIC RANK
85.6%
IN LABOR FORCE | AGE 25-29
99.8/ 100
METRIC RATING
47th/ 347
METRIC RANK
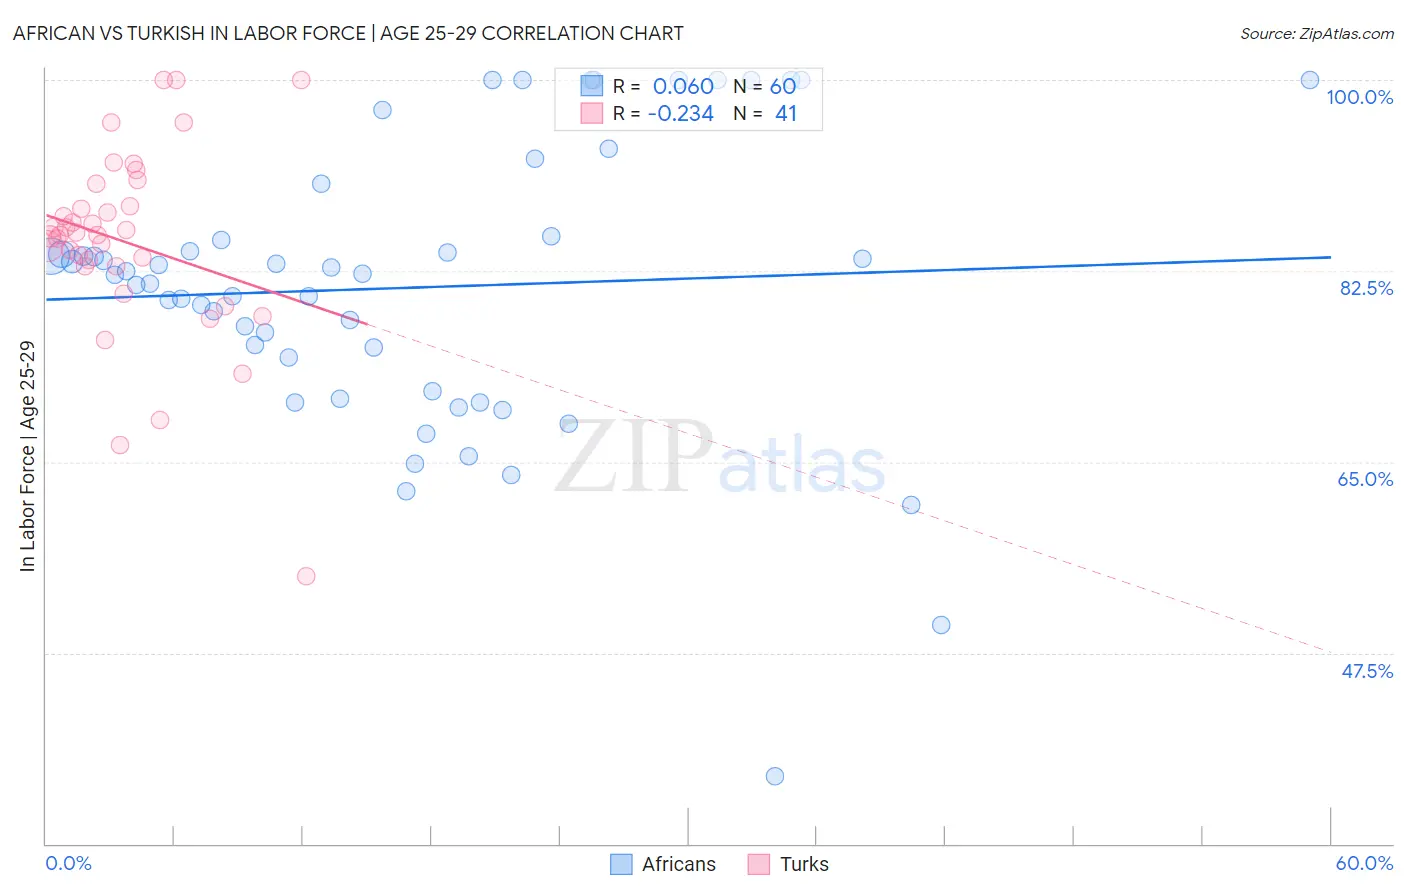
African vs Turkish In Labor Force | Age 25-29 Correlation Chart
The statistical analysis conducted on geographies consisting of 469,793,386 people shows a slight positive correlation between the proportion of Africans and labor force participation rate among population between the ages 25 and 29 in the United States with a correlation coefficient (R) of 0.060 and weighted average of 83.2%. Similarly, the statistical analysis conducted on geographies consisting of 271,804,418 people shows a weak negative correlation between the proportion of Turks and labor force participation rate among population between the ages 25 and 29 in the United States with a correlation coefficient (R) of -0.234 and weighted average of 85.6%, a difference of 2.9%.
In Labor Force | Age 25-29 Correlation Summary
| Measurement | African | Turkish |
| Minimum | 36.2% | 54.5% |
| Maximum | 100.0% | 100.0% |
| Range | 63.8% | 45.5% |
| Mean | 81.0% | 85.1% |
| Median | 82.2% | 85.8% |
| Interquartile 25% (IQ1) | 73.0% | 82.9% |
| Interquartile 75% (IQ3) | 85.5% | 89.5% |
| Interquartile Range (IQR) | 12.5% | 6.5% |
| Standard Deviation (Sample) | 13.1% | 8.8% |
| Standard Deviation (Population) | 12.9% | 8.7% |
Similar Demographics by In Labor Force | Age 25-29
Demographics Similar to Africans by In Labor Force | Age 25-29
In terms of in labor force | age 25-29, the demographic groups most similar to Africans are Immigrants from Cuba (83.2%, a difference of 0.050%), British West Indian (83.2%, a difference of 0.060%), Samoan (83.3%, a difference of 0.070%), Immigrants from Honduras (83.3%, a difference of 0.070%), and Dominican (83.2%, a difference of 0.080%).
| Demographics | Rating | Rank | In Labor Force | Age 25-29 |
| Basques | 0.0 /100 | #270 | Tragic 83.4% |
| Hondurans | 0.0 /100 | #271 | Tragic 83.4% |
| Immigrants | Caribbean | 0.0 /100 | #272 | Tragic 83.4% |
| Immigrants | Dominica | 0.0 /100 | #273 | Tragic 83.4% |
| Marshallese | 0.0 /100 | #274 | Tragic 83.3% |
| Samoans | 0.0 /100 | #275 | Tragic 83.3% |
| Immigrants | Honduras | 0.0 /100 | #276 | Tragic 83.3% |
| Africans | 0.0 /100 | #277 | Tragic 83.2% |
| Immigrants | Cuba | 0.0 /100 | #278 | Tragic 83.2% |
| British West Indians | 0.0 /100 | #279 | Tragic 83.2% |
| Dominicans | 0.0 /100 | #280 | Tragic 83.2% |
| Immigrants | Dominican Republic | 0.0 /100 | #281 | Tragic 83.1% |
| Americans | 0.0 /100 | #282 | Tragic 83.1% |
| Immigrants | Azores | 0.0 /100 | #283 | Tragic 83.1% |
| Nicaraguans | 0.0 /100 | #284 | Tragic 83.1% |
Demographics Similar to Turks by In Labor Force | Age 25-29
In terms of in labor force | age 25-29, the demographic groups most similar to Turks are Italian (85.6%, a difference of 0.0%), Czech (85.6%, a difference of 0.020%), Swedish (85.6%, a difference of 0.020%), Yugoslavian (85.6%, a difference of 0.040%), and Immigrants from Latvia (85.6%, a difference of 0.050%).
| Demographics | Rating | Rank | In Labor Force | Age 25-29 |
| Immigrants | Albania | 99.9 /100 | #40 | Exceptional 85.7% |
| Immigrants | Greece | 99.9 /100 | #41 | Exceptional 85.7% |
| Immigrants | Eritrea | 99.9 /100 | #42 | Exceptional 85.7% |
| Immigrants | India | 99.9 /100 | #43 | Exceptional 85.7% |
| Macedonians | 99.9 /100 | #44 | Exceptional 85.7% |
| Immigrants | Sierra Leone | 99.9 /100 | #45 | Exceptional 85.7% |
| Czechs | 99.8 /100 | #46 | Exceptional 85.6% |
| Turks | 99.8 /100 | #47 | Exceptional 85.6% |
| Italians | 99.8 /100 | #48 | Exceptional 85.6% |
| Swedes | 99.8 /100 | #49 | Exceptional 85.6% |
| Yugoslavians | 99.8 /100 | #50 | Exceptional 85.6% |
| Immigrants | Latvia | 99.8 /100 | #51 | Exceptional 85.6% |
| Immigrants | Poland | 99.7 /100 | #52 | Exceptional 85.6% |
| Belgians | 99.7 /100 | #53 | Exceptional 85.5% |
| Albanians | 99.7 /100 | #54 | Exceptional 85.5% |