Cheyenne vs Inupiat In Labor Force | Age > 16
COMPARE
Cheyenne
Inupiat
In Labor Force | Age > 16
In Labor Force | Age > 16 Comparison
Cheyenne
Inupiat
62.0%
IN LABOR FORCE | AGE > 16
0.0/ 100
METRIC RATING
324th/ 347
METRIC RANK
64.3%
IN LABOR FORCE | AGE > 16
0.8/ 100
METRIC RATING
257th/ 347
METRIC RANK
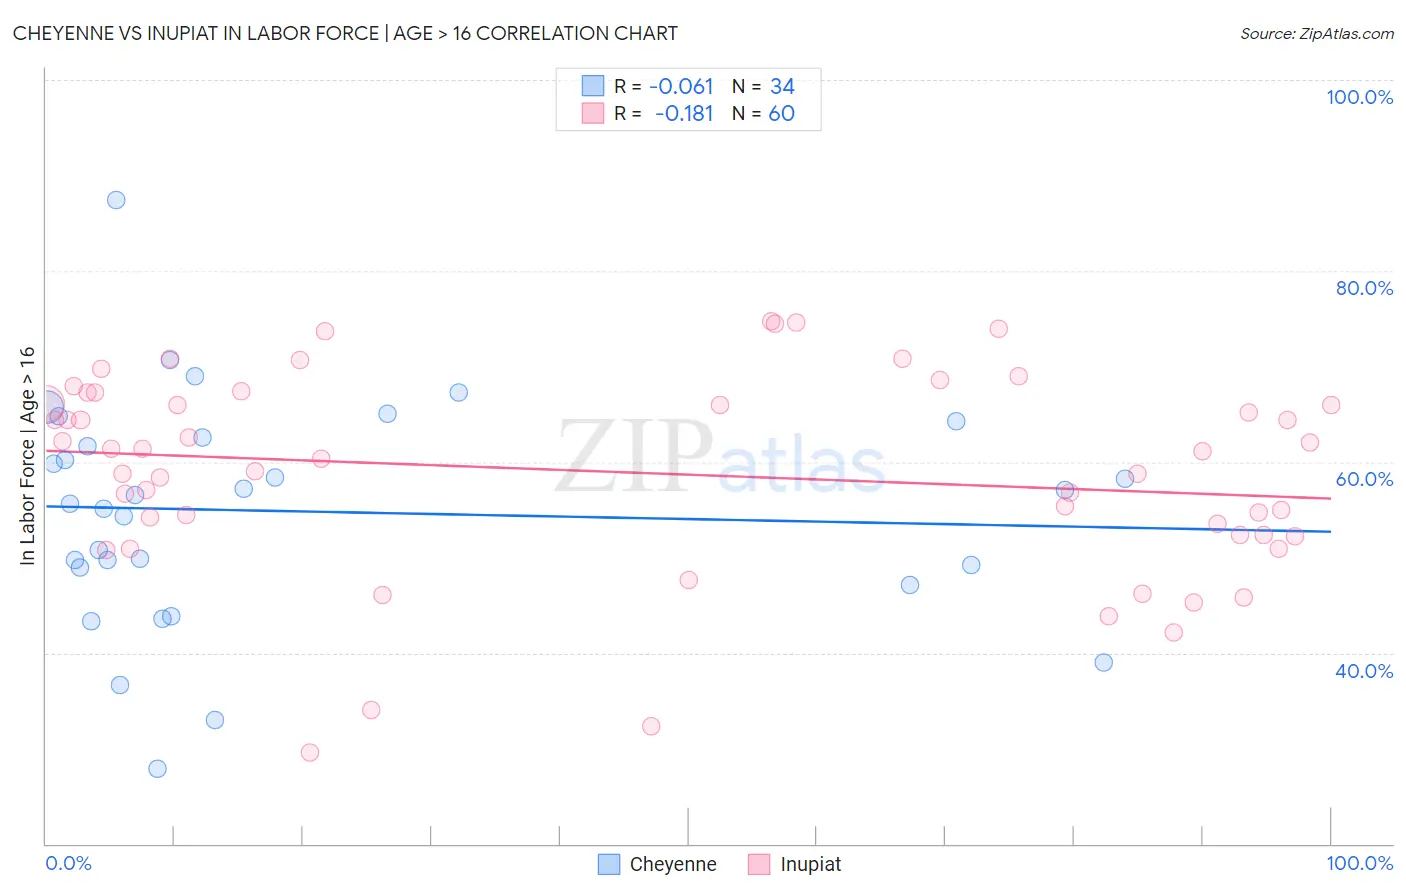
Cheyenne vs Inupiat In Labor Force | Age > 16 Correlation Chart
The statistical analysis conducted on geographies consisting of 80,712,848 people shows a slight negative correlation between the proportion of Cheyenne and labor force participation rate among population ages 16 and over in the United States with a correlation coefficient (R) of -0.061 and weighted average of 62.0%. Similarly, the statistical analysis conducted on geographies consisting of 96,350,429 people shows a poor negative correlation between the proportion of Inupiat and labor force participation rate among population ages 16 and over in the United States with a correlation coefficient (R) of -0.181 and weighted average of 64.3%, a difference of 3.7%.
In Labor Force | Age > 16 Correlation Summary
| Measurement | Cheyenne | Inupiat |
| Minimum | 27.9% | 29.5% |
| Maximum | 87.4% | 74.7% |
| Range | 59.5% | 45.2% |
| Mean | 54.8% | 58.9% |
| Median | 56.1% | 60.7% |
| Interquartile 25% (IQ1) | 49.0% | 52.3% |
| Interquartile 75% (IQ3) | 62.5% | 66.6% |
| Interquartile Range (IQR) | 13.5% | 14.3% |
| Standard Deviation (Sample) | 11.9% | 10.6% |
| Standard Deviation (Population) | 11.7% | 10.5% |
Similar Demographics by In Labor Force | Age > 16
Demographics Similar to Cheyenne by In Labor Force | Age > 16
In terms of in labor force | age > 16, the demographic groups most similar to Cheyenne are Seminole (62.0%, a difference of 0.040%), Cherokee (61.9%, a difference of 0.050%), Ottawa (62.0%, a difference of 0.070%), American (62.1%, a difference of 0.22%), and Sioux (61.8%, a difference of 0.22%).
| Demographics | Rating | Rank | In Labor Force | Age > 16 |
| Kiowa | 0.0 /100 | #317 | Tragic 62.4% |
| Chickasaw | 0.0 /100 | #318 | Tragic 62.3% |
| Arapaho | 0.0 /100 | #319 | Tragic 62.1% |
| Yakama | 0.0 /100 | #320 | Tragic 62.1% |
| Americans | 0.0 /100 | #321 | Tragic 62.1% |
| Ottawa | 0.0 /100 | #322 | Tragic 62.0% |
| Seminole | 0.0 /100 | #323 | Tragic 62.0% |
| Cheyenne | 0.0 /100 | #324 | Tragic 62.0% |
| Cherokee | 0.0 /100 | #325 | Tragic 61.9% |
| Sioux | 0.0 /100 | #326 | Tragic 61.8% |
| Cajuns | 0.0 /100 | #327 | Tragic 61.8% |
| Dutch West Indians | 0.0 /100 | #328 | Tragic 61.7% |
| Choctaw | 0.0 /100 | #329 | Tragic 61.5% |
| Creek | 0.0 /100 | #330 | Tragic 61.3% |
| Ute | 0.0 /100 | #331 | Tragic 60.9% |
Demographics Similar to Inupiat by In Labor Force | Age > 16
In terms of in labor force | age > 16, the demographic groups most similar to Inupiat are Immigrants from Scotland (64.2%, a difference of 0.020%), Immigrants from Mexico (64.3%, a difference of 0.040%), Immigrants from Western Europe (64.2%, a difference of 0.050%), Marshallese (64.2%, a difference of 0.060%), and Basque (64.2%, a difference of 0.060%).
| Demographics | Rating | Rank | In Labor Force | Age > 16 |
| British West Indians | 1.8 /100 | #250 | Tragic 64.4% |
| Portuguese | 1.6 /100 | #251 | Tragic 64.4% |
| Immigrants | Dominican Republic | 1.5 /100 | #252 | Tragic 64.4% |
| Czechoslovakians | 1.4 /100 | #253 | Tragic 64.3% |
| Immigrants | Uzbekistan | 1.4 /100 | #254 | Tragic 64.3% |
| Hispanics or Latinos | 1.1 /100 | #255 | Tragic 64.3% |
| Immigrants | Mexico | 1.0 /100 | #256 | Tragic 64.3% |
| Inupiat | 0.8 /100 | #257 | Tragic 64.3% |
| Immigrants | Scotland | 0.8 /100 | #258 | Tragic 64.2% |
| Immigrants | Western Europe | 0.7 /100 | #259 | Tragic 64.2% |
| Marshallese | 0.7 /100 | #260 | Tragic 64.2% |
| Basques | 0.7 /100 | #261 | Tragic 64.2% |
| Finns | 0.7 /100 | #262 | Tragic 64.2% |
| Bahamians | 0.6 /100 | #263 | Tragic 64.2% |
| Dutch | 0.6 /100 | #264 | Tragic 64.2% |