Cheyenne vs Immigrants from Latvia In Labor Force | Age > 16
COMPARE
Cheyenne
Immigrants from Latvia
In Labor Force | Age > 16
In Labor Force | Age > 16 Comparison
Cheyenne
Immigrants from Latvia
62.0%
IN LABOR FORCE | AGE > 16
0.0/ 100
METRIC RATING
324th/ 347
METRIC RANK
65.1%
IN LABOR FORCE | AGE > 16
42.9/ 100
METRIC RATING
180th/ 347
METRIC RANK
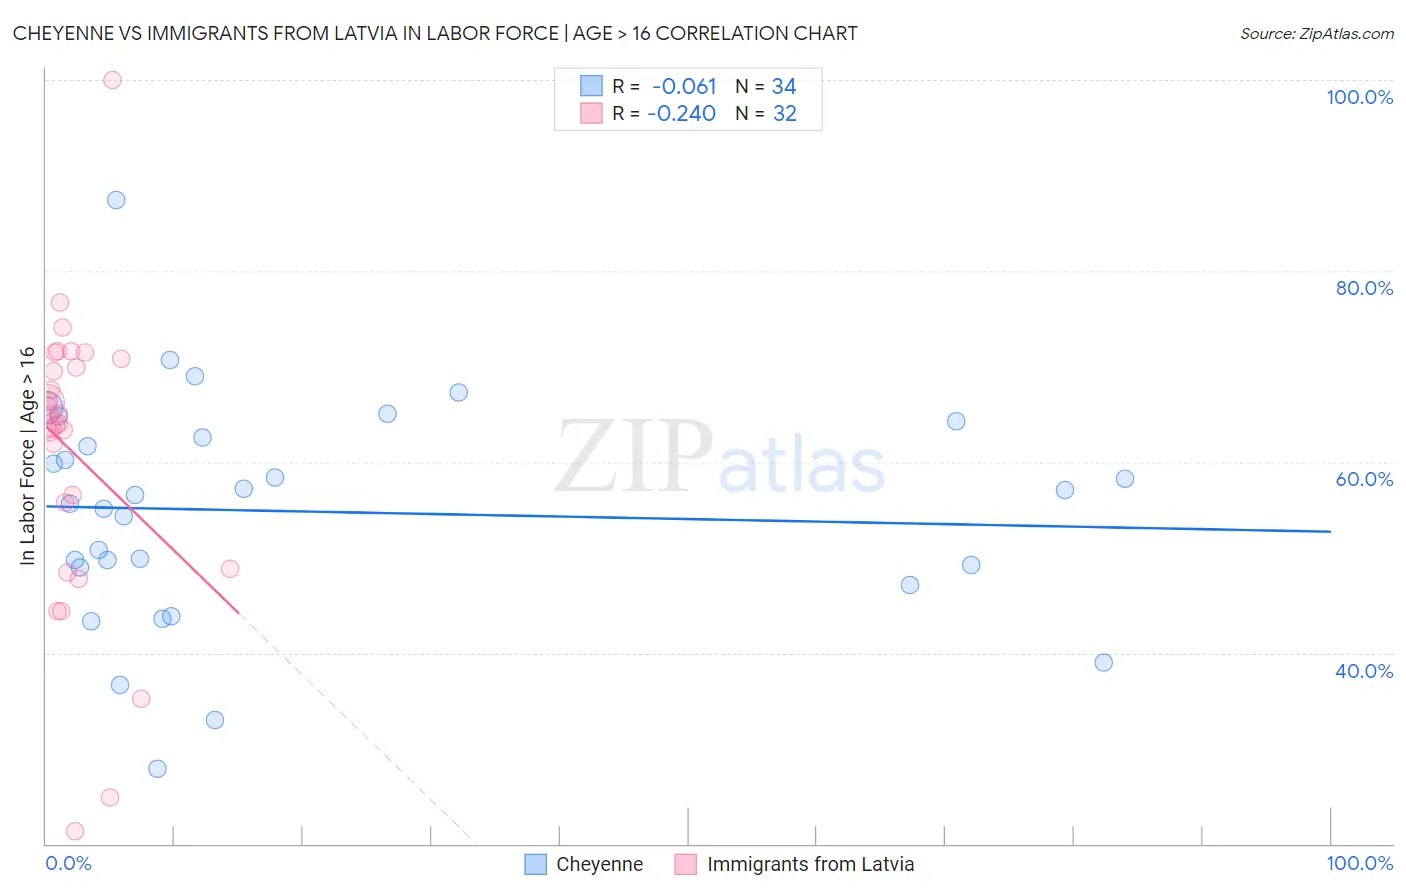
Cheyenne vs Immigrants from Latvia In Labor Force | Age > 16 Correlation Chart
The statistical analysis conducted on geographies consisting of 80,712,848 people shows a slight negative correlation between the proportion of Cheyenne and labor force participation rate among population ages 16 and over in the United States with a correlation coefficient (R) of -0.061 and weighted average of 62.0%. Similarly, the statistical analysis conducted on geographies consisting of 113,739,608 people shows a weak negative correlation between the proportion of Immigrants from Latvia and labor force participation rate among population ages 16 and over in the United States with a correlation coefficient (R) of -0.240 and weighted average of 65.1%, a difference of 5.0%.
In Labor Force | Age > 16 Correlation Summary
| Measurement | Cheyenne | Immigrants from Latvia |
| Minimum | 27.9% | 21.3% |
| Maximum | 87.4% | 100.0% |
| Range | 59.5% | 78.7% |
| Mean | 54.8% | 60.9% |
| Median | 56.1% | 64.5% |
| Interquartile 25% (IQ1) | 49.0% | 52.3% |
| Interquartile 75% (IQ3) | 62.5% | 70.3% |
| Interquartile Range (IQR) | 13.5% | 18.1% |
| Standard Deviation (Sample) | 11.9% | 15.5% |
| Standard Deviation (Population) | 11.7% | 15.3% |
Similar Demographics by In Labor Force | Age > 16
Demographics Similar to Cheyenne by In Labor Force | Age > 16
In terms of in labor force | age > 16, the demographic groups most similar to Cheyenne are Seminole (62.0%, a difference of 0.040%), Cherokee (61.9%, a difference of 0.050%), Ottawa (62.0%, a difference of 0.070%), American (62.1%, a difference of 0.22%), and Sioux (61.8%, a difference of 0.22%).
| Demographics | Rating | Rank | In Labor Force | Age > 16 |
| Kiowa | 0.0 /100 | #317 | Tragic 62.4% |
| Chickasaw | 0.0 /100 | #318 | Tragic 62.3% |
| Arapaho | 0.0 /100 | #319 | Tragic 62.1% |
| Yakama | 0.0 /100 | #320 | Tragic 62.1% |
| Americans | 0.0 /100 | #321 | Tragic 62.1% |
| Ottawa | 0.0 /100 | #322 | Tragic 62.0% |
| Seminole | 0.0 /100 | #323 | Tragic 62.0% |
| Cheyenne | 0.0 /100 | #324 | Tragic 62.0% |
| Cherokee | 0.0 /100 | #325 | Tragic 61.9% |
| Sioux | 0.0 /100 | #326 | Tragic 61.8% |
| Cajuns | 0.0 /100 | #327 | Tragic 61.8% |
| Dutch West Indians | 0.0 /100 | #328 | Tragic 61.7% |
| Choctaw | 0.0 /100 | #329 | Tragic 61.5% |
| Creek | 0.0 /100 | #330 | Tragic 61.3% |
| Ute | 0.0 /100 | #331 | Tragic 60.9% |
Demographics Similar to Immigrants from Latvia by In Labor Force | Age > 16
In terms of in labor force | age > 16, the demographic groups most similar to Immigrants from Latvia are Immigrants from Haiti (65.1%, a difference of 0.0%), Immigrants from Panama (65.1%, a difference of 0.010%), Immigrants from Nicaragua (65.1%, a difference of 0.020%), Trinidadian and Tobagonian (65.1%, a difference of 0.030%), and Soviet Union (65.0%, a difference of 0.030%).
| Demographics | Rating | Rank | In Labor Force | Age > 16 |
| Immigrants | Ukraine | 53.7 /100 | #173 | Average 65.1% |
| Macedonians | 50.0 /100 | #174 | Average 65.1% |
| Nicaraguans | 49.7 /100 | #175 | Average 65.1% |
| Swedes | 47.4 /100 | #176 | Average 65.1% |
| Eastern Europeans | 46.2 /100 | #177 | Average 65.1% |
| Trinidadians and Tobagonians | 45.2 /100 | #178 | Average 65.1% |
| Immigrants | Haiti | 43.3 /100 | #179 | Average 65.1% |
| Immigrants | Latvia | 42.9 /100 | #180 | Average 65.1% |
| Immigrants | Panama | 42.4 /100 | #181 | Average 65.1% |
| Immigrants | Nicaragua | 41.1 /100 | #182 | Average 65.1% |
| Soviet Union | 40.5 /100 | #183 | Average 65.0% |
| Carpatho Rusyns | 40.0 /100 | #184 | Average 65.0% |
| Syrians | 40.0 /100 | #185 | Average 65.0% |
| Immigrants | Switzerland | 38.2 /100 | #186 | Fair 65.0% |
| Immigrants | Croatia | 35.7 /100 | #187 | Fair 65.0% |