Immigrants from Morocco vs Immigrants from Hong Kong In Labor Force | Age 20-24
COMPARE
Immigrants from Morocco
Immigrants from Hong Kong
In Labor Force | Age 20-24
In Labor Force | Age 20-24 Comparison
Immigrants from Morocco
Immigrants from Hong Kong
75.9%
IN LABOR FORCE | AGE 20-24
95.8/ 100
METRIC RATING
110th/ 347
METRIC RANK
71.6%
IN LABOR FORCE | AGE 20-24
0.0/ 100
METRIC RATING
318th/ 347
METRIC RANK
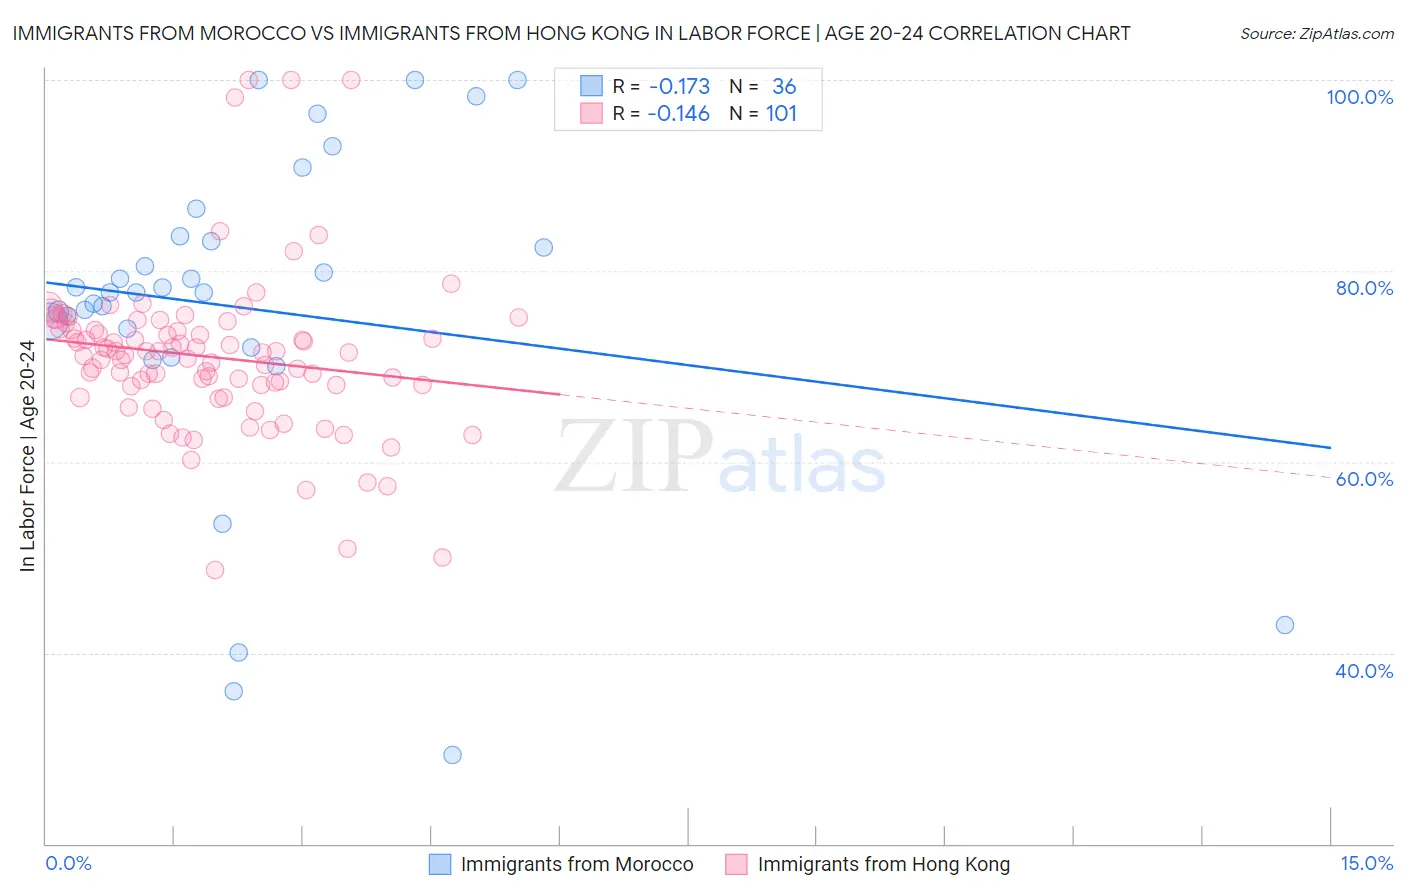
Immigrants from Morocco vs Immigrants from Hong Kong In Labor Force | Age 20-24 Correlation Chart
The statistical analysis conducted on geographies consisting of 178,862,566 people shows a poor negative correlation between the proportion of Immigrants from Morocco and labor force participation rate among population between the ages 20 and 24 in the United States with a correlation coefficient (R) of -0.173 and weighted average of 75.9%. Similarly, the statistical analysis conducted on geographies consisting of 253,918,765 people shows a poor negative correlation between the proportion of Immigrants from Hong Kong and labor force participation rate among population between the ages 20 and 24 in the United States with a correlation coefficient (R) of -0.146 and weighted average of 71.6%, a difference of 6.0%.
In Labor Force | Age 20-24 Correlation Summary
| Measurement | Immigrants from Morocco | Immigrants from Hong Kong |
| Minimum | 29.3% | 48.7% |
| Maximum | 100.0% | 100.0% |
| Range | 70.7% | 51.3% |
| Mean | 76.0% | 71.0% |
| Median | 77.8% | 71.4% |
| Interquartile 25% (IQ1) | 72.9% | 67.9% |
| Interquartile 75% (IQ3) | 83.4% | 73.9% |
| Interquartile Range (IQR) | 10.5% | 5.9% |
| Standard Deviation (Sample) | 17.1% | 8.5% |
| Standard Deviation (Population) | 16.9% | 8.4% |
Similar Demographics by In Labor Force | Age 20-24
Demographics Similar to Immigrants from Morocco by In Labor Force | Age 20-24
In terms of in labor force | age 20-24, the demographic groups most similar to Immigrants from Morocco are Cherokee (75.9%, a difference of 0.0%), Ukrainian (75.9%, a difference of 0.010%), Immigrants from Canada (75.9%, a difference of 0.020%), Immigrants from Netherlands (75.9%, a difference of 0.050%), and Immigrants from Zimbabwe (75.9%, a difference of 0.060%).
| Demographics | Rating | Rank | In Labor Force | Age 20-24 |
| Immigrants | North Macedonia | 97.5 /100 | #103 | Exceptional 76.1% |
| Macedonians | 97.2 /100 | #104 | Exceptional 76.0% |
| Immigrants | Nepal | 97.2 /100 | #105 | Exceptional 76.0% |
| Immigrants | Uganda | 97.1 /100 | #106 | Exceptional 76.0% |
| Greeks | 96.9 /100 | #107 | Exceptional 76.0% |
| Iraqis | 96.6 /100 | #108 | Exceptional 76.0% |
| Cherokee | 95.8 /100 | #109 | Exceptional 75.9% |
| Immigrants | Morocco | 95.8 /100 | #110 | Exceptional 75.9% |
| Ukrainians | 95.7 /100 | #111 | Exceptional 75.9% |
| Immigrants | Canada | 95.6 /100 | #112 | Exceptional 75.9% |
| Immigrants | Netherlands | 95.3 /100 | #113 | Exceptional 75.9% |
| Immigrants | Zimbabwe | 95.1 /100 | #114 | Exceptional 75.9% |
| Alaska Natives | 95.1 /100 | #115 | Exceptional 75.9% |
| Immigrants | North America | 95.0 /100 | #116 | Exceptional 75.9% |
| Assyrians/Chaldeans/Syriacs | 94.9 /100 | #117 | Exceptional 75.9% |
Demographics Similar to Immigrants from Hong Kong by In Labor Force | Age 20-24
In terms of in labor force | age 20-24, the demographic groups most similar to Immigrants from Hong Kong are Immigrants from Israel (71.6%, a difference of 0.030%), Immigrants from Armenia (71.7%, a difference of 0.090%), Trinidadian and Tobagonian (71.5%, a difference of 0.11%), Immigrants from Taiwan (71.5%, a difference of 0.16%), and Immigrants from Eastern Asia (71.8%, a difference of 0.26%).
| Demographics | Rating | Rank | In Labor Force | Age 20-24 |
| Apache | 0.0 /100 | #311 | Tragic 72.0% |
| Immigrants | Caribbean | 0.0 /100 | #312 | Tragic 71.9% |
| Immigrants | Dominica | 0.0 /100 | #313 | Tragic 71.9% |
| Indians (Asian) | 0.0 /100 | #314 | Tragic 71.9% |
| Immigrants | Iran | 0.0 /100 | #315 | Tragic 71.8% |
| Immigrants | Eastern Asia | 0.0 /100 | #316 | Tragic 71.8% |
| Immigrants | Armenia | 0.0 /100 | #317 | Tragic 71.7% |
| Immigrants | Hong Kong | 0.0 /100 | #318 | Tragic 71.6% |
| Immigrants | Israel | 0.0 /100 | #319 | Tragic 71.6% |
| Trinidadians and Tobagonians | 0.0 /100 | #320 | Tragic 71.5% |
| Immigrants | Taiwan | 0.0 /100 | #321 | Tragic 71.5% |
| Filipinos | 0.0 /100 | #322 | Tragic 71.4% |
| West Indians | 0.0 /100 | #323 | Tragic 71.3% |
| Immigrants | Dominican Republic | 0.0 /100 | #324 | Tragic 71.2% |
| Barbadians | 0.0 /100 | #325 | Tragic 71.1% |