Immigrants from Germany vs Immigrants from Hong Kong In Labor Force | Age 20-24
COMPARE
Immigrants from Germany
Immigrants from Hong Kong
In Labor Force | Age 20-24
In Labor Force | Age 20-24 Comparison
Immigrants from Germany
Immigrants from Hong Kong
76.2%
IN LABOR FORCE | AGE 20-24
98.5/ 100
METRIC RATING
95th/ 347
METRIC RANK
71.6%
IN LABOR FORCE | AGE 20-24
0.0/ 100
METRIC RATING
318th/ 347
METRIC RANK
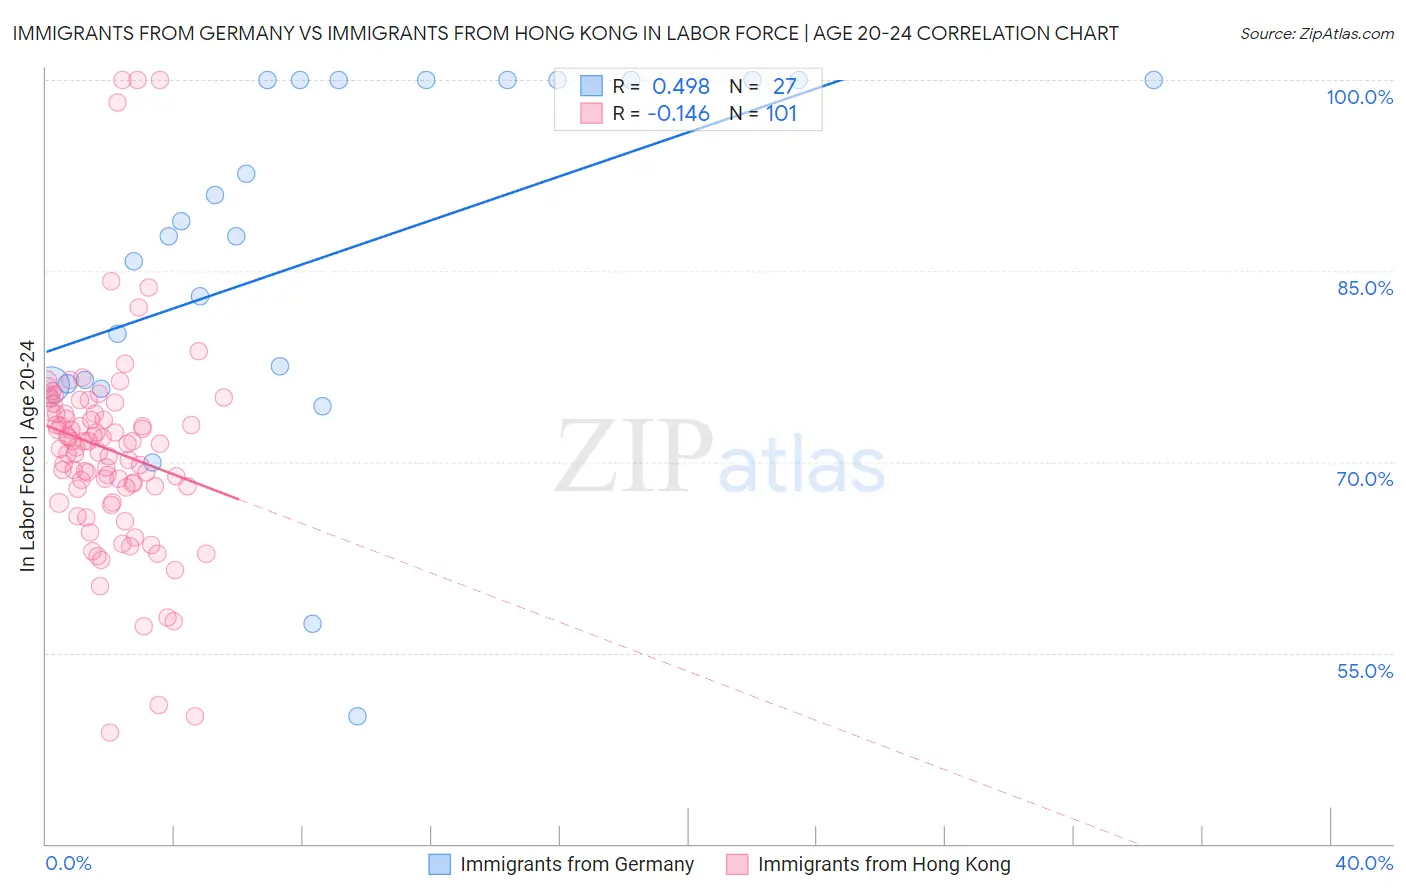
Immigrants from Germany vs Immigrants from Hong Kong In Labor Force | Age 20-24 Correlation Chart
The statistical analysis conducted on geographies consisting of 463,533,705 people shows a moderate positive correlation between the proportion of Immigrants from Germany and labor force participation rate among population between the ages 20 and 24 in the United States with a correlation coefficient (R) of 0.498 and weighted average of 76.2%. Similarly, the statistical analysis conducted on geographies consisting of 253,918,765 people shows a poor negative correlation between the proportion of Immigrants from Hong Kong and labor force participation rate among population between the ages 20 and 24 in the United States with a correlation coefficient (R) of -0.146 and weighted average of 71.6%, a difference of 6.4%.
In Labor Force | Age 20-24 Correlation Summary
| Measurement | Immigrants from Germany | Immigrants from Hong Kong |
| Minimum | 50.0% | 48.7% |
| Maximum | 100.0% | 100.0% |
| Range | 50.0% | 51.3% |
| Mean | 86.3% | 71.0% |
| Median | 87.8% | 71.4% |
| Interquartile 25% (IQ1) | 76.1% | 67.9% |
| Interquartile 75% (IQ3) | 100.0% | 73.9% |
| Interquartile Range (IQR) | 23.9% | 5.9% |
| Standard Deviation (Sample) | 14.0% | 8.5% |
| Standard Deviation (Population) | 13.7% | 8.4% |
Similar Demographics by In Labor Force | Age 20-24
Demographics Similar to Immigrants from Germany by In Labor Force | Age 20-24
In terms of in labor force | age 20-24, the demographic groups most similar to Immigrants from Germany are Potawatomi (76.2%, a difference of 0.0%), Nonimmigrants (76.2%, a difference of 0.010%), Hungarian (76.3%, a difference of 0.10%), Immigrants from Lithuania (76.1%, a difference of 0.11%), and Immigrants from Oceania (76.1%, a difference of 0.11%).
| Demographics | Rating | Rank | In Labor Force | Age 20-24 |
| Spanish | 99.2 /100 | #88 | Exceptional 76.4% |
| Bulgarians | 99.2 /100 | #89 | Exceptional 76.4% |
| Immigrants | Burma/Myanmar | 99.1 /100 | #90 | Exceptional 76.3% |
| Sierra Leoneans | 99.0 /100 | #91 | Exceptional 76.3% |
| Maltese | 98.9 /100 | #92 | Exceptional 76.3% |
| Hungarians | 98.9 /100 | #93 | Exceptional 76.3% |
| Potawatomi | 98.5 /100 | #94 | Exceptional 76.2% |
| Immigrants | Germany | 98.5 /100 | #95 | Exceptional 76.2% |
| Immigrants | Nonimmigrants | 98.5 /100 | #96 | Exceptional 76.2% |
| Immigrants | Lithuania | 98.0 /100 | #97 | Exceptional 76.1% |
| Immigrants | Oceania | 98.0 /100 | #98 | Exceptional 76.1% |
| Americans | 97.8 /100 | #99 | Exceptional 76.1% |
| Shoshone | 97.8 /100 | #100 | Exceptional 76.1% |
| Immigrants | Poland | 97.7 /100 | #101 | Exceptional 76.1% |
| Latvians | 97.6 /100 | #102 | Exceptional 76.1% |
Demographics Similar to Immigrants from Hong Kong by In Labor Force | Age 20-24
In terms of in labor force | age 20-24, the demographic groups most similar to Immigrants from Hong Kong are Immigrants from Israel (71.6%, a difference of 0.030%), Immigrants from Armenia (71.7%, a difference of 0.090%), Trinidadian and Tobagonian (71.5%, a difference of 0.11%), Immigrants from Taiwan (71.5%, a difference of 0.16%), and Immigrants from Eastern Asia (71.8%, a difference of 0.26%).
| Demographics | Rating | Rank | In Labor Force | Age 20-24 |
| Apache | 0.0 /100 | #311 | Tragic 72.0% |
| Immigrants | Caribbean | 0.0 /100 | #312 | Tragic 71.9% |
| Immigrants | Dominica | 0.0 /100 | #313 | Tragic 71.9% |
| Indians (Asian) | 0.0 /100 | #314 | Tragic 71.9% |
| Immigrants | Iran | 0.0 /100 | #315 | Tragic 71.8% |
| Immigrants | Eastern Asia | 0.0 /100 | #316 | Tragic 71.8% |
| Immigrants | Armenia | 0.0 /100 | #317 | Tragic 71.7% |
| Immigrants | Hong Kong | 0.0 /100 | #318 | Tragic 71.6% |
| Immigrants | Israel | 0.0 /100 | #319 | Tragic 71.6% |
| Trinidadians and Tobagonians | 0.0 /100 | #320 | Tragic 71.5% |
| Immigrants | Taiwan | 0.0 /100 | #321 | Tragic 71.5% |
| Filipinos | 0.0 /100 | #322 | Tragic 71.4% |
| West Indians | 0.0 /100 | #323 | Tragic 71.3% |
| Immigrants | Dominican Republic | 0.0 /100 | #324 | Tragic 71.2% |
| Barbadians | 0.0 /100 | #325 | Tragic 71.1% |