Celtic vs Immigrants from Hong Kong Nursery School
COMPARE
Celtic
Immigrants from Hong Kong
Nursery School
Nursery School Comparison
Celtics
Immigrants from Hong Kong
98.5%
NURSERY SCHOOL
99.8/ 100
METRIC RATING
50th/ 347
METRIC RANK
97.4%
NURSERY SCHOOL
0.0/ 100
METRIC RATING
287th/ 347
METRIC RANK
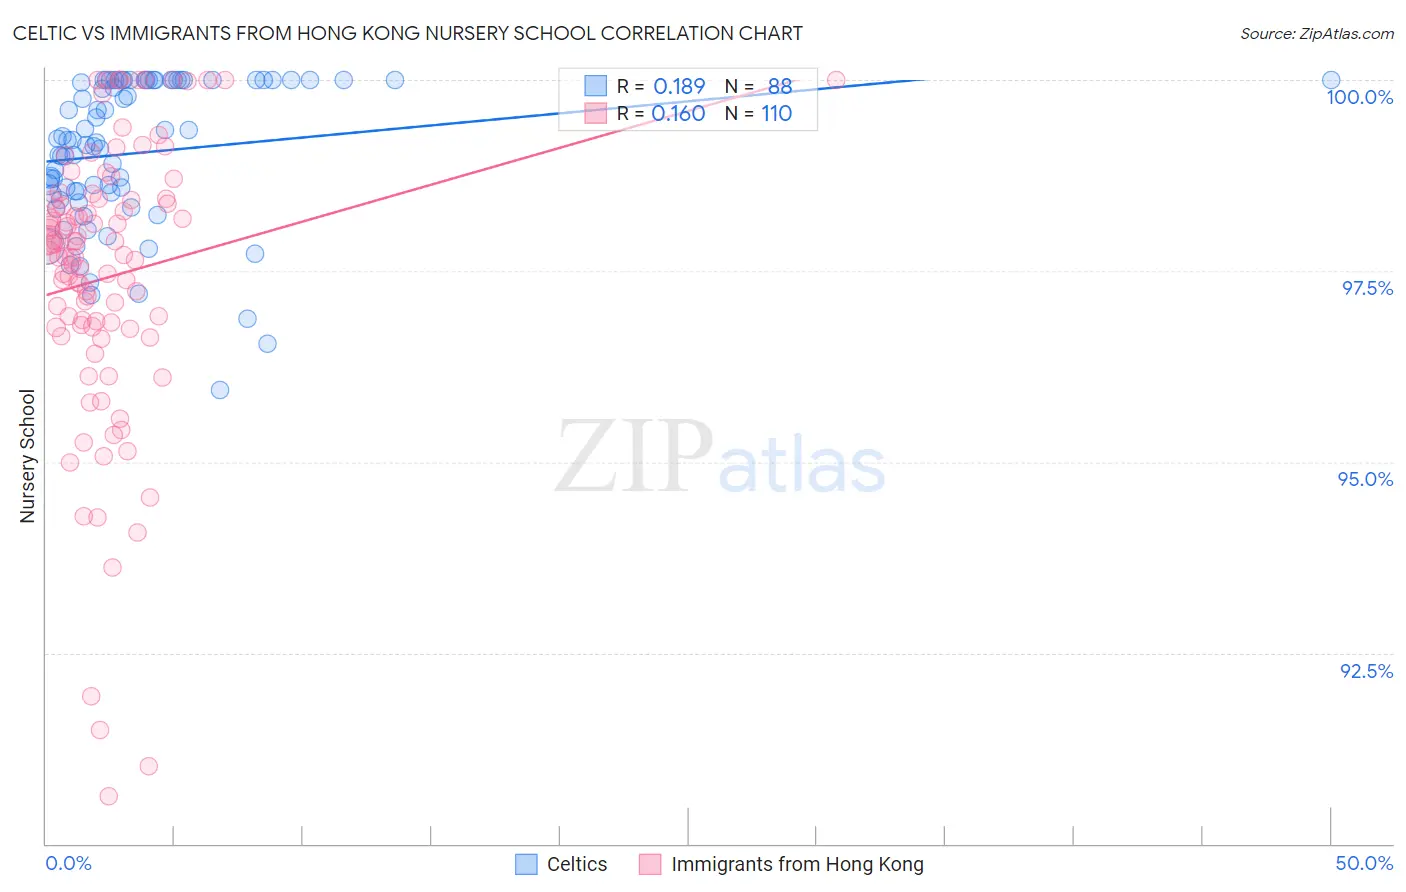
Celtic vs Immigrants from Hong Kong Nursery School Correlation Chart
The statistical analysis conducted on geographies consisting of 168,875,705 people shows a poor positive correlation between the proportion of Celtics and percentage of population with at least nursery school education in the United States with a correlation coefficient (R) of 0.189 and weighted average of 98.5%. Similarly, the statistical analysis conducted on geographies consisting of 253,948,669 people shows a poor positive correlation between the proportion of Immigrants from Hong Kong and percentage of population with at least nursery school education in the United States with a correlation coefficient (R) of 0.160 and weighted average of 97.4%, a difference of 1.1%.
Nursery School Correlation Summary
| Measurement | Celtic | Immigrants from Hong Kong |
| Minimum | 95.9% | 90.6% |
| Maximum | 100.0% | 100.0% |
| Range | 4.1% | 9.4% |
| Mean | 99.0% | 97.4% |
| Median | 99.2% | 97.7% |
| Interquartile 25% (IQ1) | 98.5% | 96.8% |
| Interquartile 75% (IQ3) | 100.0% | 98.4% |
| Interquartile Range (IQR) | 1.5% | 1.7% |
| Standard Deviation (Sample) | 0.96% | 1.9% |
| Standard Deviation (Population) | 0.95% | 1.9% |
Similar Demographics by Nursery School
Demographics Similar to Celtics by Nursery School
In terms of nursery school, the demographic groups most similar to Celtics are Ottawa (98.5%, a difference of 0.0%), White/Caucasian (98.5%, a difference of 0.0%), Estonian (98.5%, a difference of 0.0%), Australian (98.5%, a difference of 0.0%), and Czechoslovakian (98.5%, a difference of 0.010%).
| Demographics | Rating | Rank | Nursery School |
| Native Hawaiians | 99.9 /100 | #43 | Exceptional 98.5% |
| Belgians | 99.9 /100 | #44 | Exceptional 98.5% |
| Northern Europeans | 99.9 /100 | #45 | Exceptional 98.5% |
| Hungarians | 99.9 /100 | #46 | Exceptional 98.5% |
| Czechoslovakians | 99.9 /100 | #47 | Exceptional 98.5% |
| Ottawa | 99.8 /100 | #48 | Exceptional 98.5% |
| Whites/Caucasians | 99.8 /100 | #49 | Exceptional 98.5% |
| Celtics | 99.8 /100 | #50 | Exceptional 98.5% |
| Estonians | 99.8 /100 | #51 | Exceptional 98.5% |
| Australians | 99.8 /100 | #52 | Exceptional 98.5% |
| Kiowa | 99.8 /100 | #53 | Exceptional 98.4% |
| Pueblo | 99.8 /100 | #54 | Exceptional 98.4% |
| Immigrants | Scotland | 99.8 /100 | #55 | Exceptional 98.4% |
| Americans | 99.8 /100 | #56 | Exceptional 98.4% |
| Austrians | 99.8 /100 | #57 | Exceptional 98.4% |
Demographics Similar to Immigrants from Hong Kong by Nursery School
In terms of nursery school, the demographic groups most similar to Immigrants from Hong Kong are Immigrants from Barbados (97.4%, a difference of 0.010%), Immigrants from Portugal (97.4%, a difference of 0.010%), Immigrants from Thailand (97.3%, a difference of 0.020%), Immigrants from West Indies (97.4%, a difference of 0.030%), and Immigrants from Trinidad and Tobago (97.4%, a difference of 0.030%).
| Demographics | Rating | Rank | Nursery School |
| Barbadians | 0.0 /100 | #280 | Tragic 97.4% |
| Trinidadians and Tobagonians | 0.0 /100 | #281 | Tragic 97.4% |
| Afghans | 0.0 /100 | #282 | Tragic 97.4% |
| Immigrants | West Indies | 0.0 /100 | #283 | Tragic 97.4% |
| Immigrants | Trinidad and Tobago | 0.0 /100 | #284 | Tragic 97.4% |
| Immigrants | Barbados | 0.0 /100 | #285 | Tragic 97.4% |
| Immigrants | Portugal | 0.0 /100 | #286 | Tragic 97.4% |
| Immigrants | Hong Kong | 0.0 /100 | #287 | Tragic 97.4% |
| Immigrants | Thailand | 0.0 /100 | #288 | Tragic 97.3% |
| Immigrants | St. Vincent and the Grenadines | 0.0 /100 | #289 | Tragic 97.3% |
| Immigrants | Afghanistan | 0.0 /100 | #290 | Tragic 97.3% |
| British West Indians | 0.0 /100 | #291 | Tragic 97.3% |
| Houma | 0.0 /100 | #292 | Tragic 97.3% |
| Malaysians | 0.0 /100 | #293 | Tragic 97.3% |
| Immigrants | Grenada | 0.0 /100 | #294 | Tragic 97.3% |