Carpatho Rusyn vs Immigrants from Bangladesh In Labor Force | Age > 16
COMPARE
Carpatho Rusyn
Immigrants from Bangladesh
In Labor Force | Age > 16
In Labor Force | Age > 16 Comparison
Carpatho Rusyns
Immigrants from Bangladesh
65.0%
IN LABOR FORCE | AGE > 16
40.0/ 100
METRIC RATING
184th/ 347
METRIC RANK
64.5%
IN LABOR FORCE | AGE > 16
3.6/ 100
METRIC RATING
240th/ 347
METRIC RANK
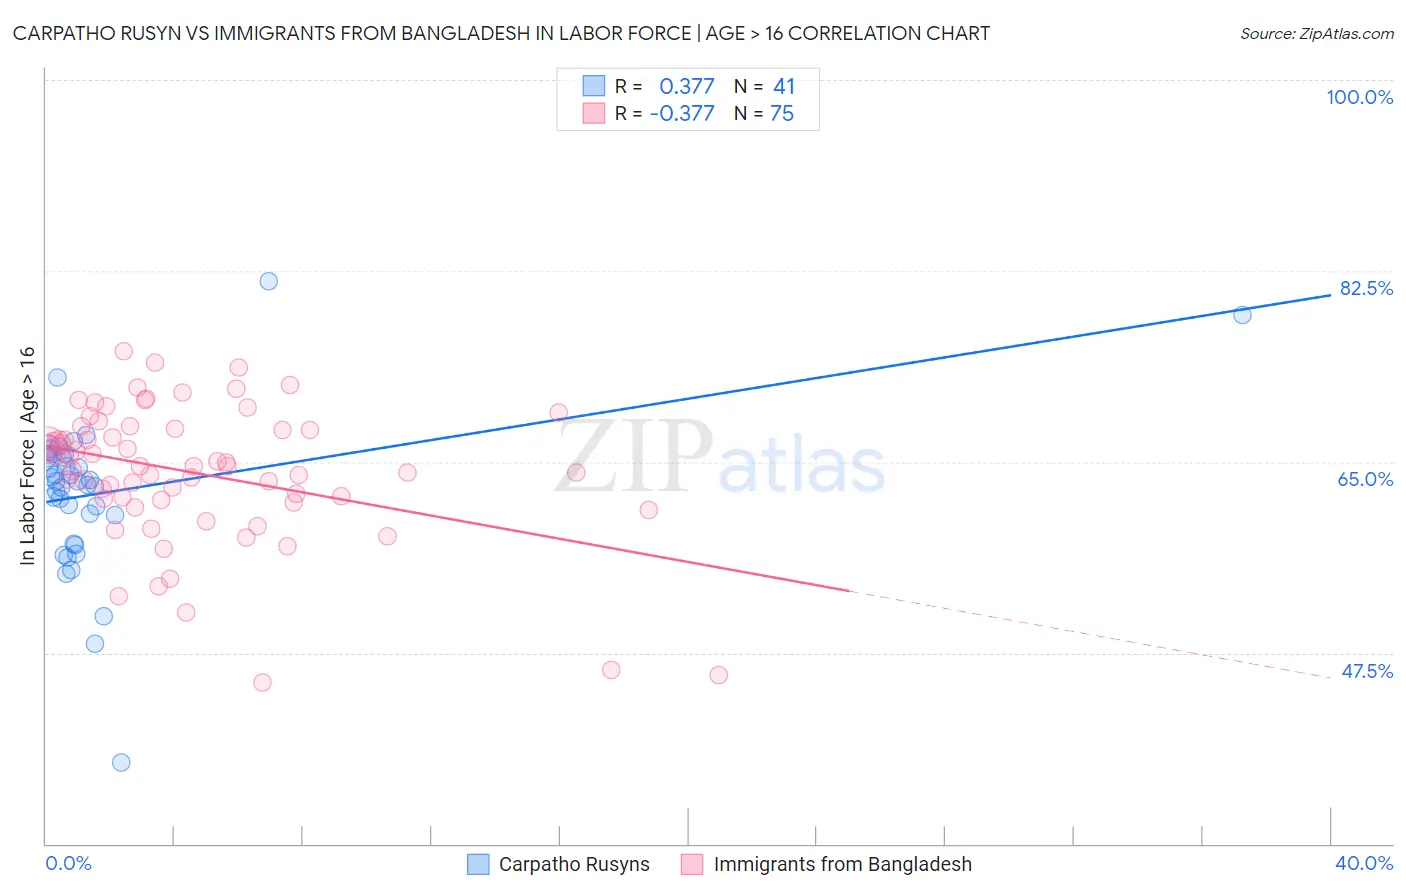
Carpatho Rusyn vs Immigrants from Bangladesh In Labor Force | Age > 16 Correlation Chart
The statistical analysis conducted on geographies consisting of 58,872,150 people shows a mild positive correlation between the proportion of Carpatho Rusyns and labor force participation rate among population ages 16 and over in the United States with a correlation coefficient (R) of 0.377 and weighted average of 65.0%. Similarly, the statistical analysis conducted on geographies consisting of 203,680,336 people shows a mild negative correlation between the proportion of Immigrants from Bangladesh and labor force participation rate among population ages 16 and over in the United States with a correlation coefficient (R) of -0.377 and weighted average of 64.5%, a difference of 0.82%.
In Labor Force | Age > 16 Correlation Summary
| Measurement | Carpatho Rusyn | Immigrants from Bangladesh |
| Minimum | 37.5% | 44.8% |
| Maximum | 81.5% | 75.2% |
| Range | 44.0% | 30.4% |
| Mean | 62.2% | 64.0% |
| Median | 63.2% | 64.6% |
| Interquartile 25% (IQ1) | 58.8% | 61.5% |
| Interquartile 75% (IQ3) | 65.5% | 68.0% |
| Interquartile Range (IQR) | 6.7% | 6.5% |
| Standard Deviation (Sample) | 7.3% | 6.3% |
| Standard Deviation (Population) | 7.2% | 6.2% |
Similar Demographics by In Labor Force | Age > 16
Demographics Similar to Carpatho Rusyns by In Labor Force | Age > 16
In terms of in labor force | age > 16, the demographic groups most similar to Carpatho Rusyns are Syrian (65.0%, a difference of 0.0%), Immigrants from Nicaragua (65.1%, a difference of 0.010%), Soviet Union (65.0%, a difference of 0.010%), Immigrants from Switzerland (65.0%, a difference of 0.020%), and Immigrants from Latvia (65.1%, a difference of 0.030%).
| Demographics | Rating | Rank | In Labor Force | Age > 16 |
| Eastern Europeans | 46.2 /100 | #177 | Average 65.1% |
| Trinidadians and Tobagonians | 45.2 /100 | #178 | Average 65.1% |
| Immigrants | Haiti | 43.3 /100 | #179 | Average 65.1% |
| Immigrants | Latvia | 42.9 /100 | #180 | Average 65.1% |
| Immigrants | Panama | 42.4 /100 | #181 | Average 65.1% |
| Immigrants | Nicaragua | 41.1 /100 | #182 | Average 65.1% |
| Soviet Union | 40.5 /100 | #183 | Average 65.0% |
| Carpatho Rusyns | 40.0 /100 | #184 | Average 65.0% |
| Syrians | 40.0 /100 | #185 | Average 65.0% |
| Immigrants | Switzerland | 38.2 /100 | #186 | Fair 65.0% |
| Immigrants | Croatia | 35.7 /100 | #187 | Fair 65.0% |
| Immigrants | Portugal | 34.8 /100 | #188 | Fair 65.0% |
| Immigrants | Greece | 34.3 /100 | #189 | Fair 65.0% |
| Barbadians | 33.9 /100 | #190 | Fair 65.0% |
| Scandinavians | 33.7 /100 | #191 | Fair 65.0% |
Demographics Similar to Immigrants from Bangladesh by In Labor Force | Age > 16
In terms of in labor force | age > 16, the demographic groups most similar to Immigrants from Bangladesh are Immigrants from Dominica (64.5%, a difference of 0.0%), Immigrants from Hungary (64.5%, a difference of 0.020%), Immigrants from Netherlands (64.5%, a difference of 0.020%), Lebanese (64.5%, a difference of 0.030%), and Immigrants from Lebanon (64.5%, a difference of 0.030%).
| Demographics | Rating | Rank | In Labor Force | Age > 16 |
| Slavs | 4.9 /100 | #233 | Tragic 64.6% |
| Vietnamese | 4.7 /100 | #234 | Tragic 64.6% |
| Austrians | 4.6 /100 | #235 | Tragic 64.6% |
| Immigrants | Norway | 4.6 /100 | #236 | Tragic 64.6% |
| Italians | 4.6 /100 | #237 | Tragic 64.6% |
| Lebanese | 3.9 /100 | #238 | Tragic 64.5% |
| Immigrants | Hungary | 3.8 /100 | #239 | Tragic 64.5% |
| Immigrants | Bangladesh | 3.6 /100 | #240 | Tragic 64.5% |
| Immigrants | Dominica | 3.5 /100 | #241 | Tragic 64.5% |
| Immigrants | Netherlands | 3.4 /100 | #242 | Tragic 64.5% |
| Immigrants | Lebanon | 3.2 /100 | #243 | Tragic 64.5% |
| Tsimshian | 3.1 /100 | #244 | Tragic 64.5% |
| West Indians | 3.0 /100 | #245 | Tragic 64.5% |
| Immigrants | Caribbean | 2.3 /100 | #246 | Tragic 64.4% |
| Swiss | 2.1 /100 | #247 | Tragic 64.4% |