Carpatho Rusyn vs Immigrants from Uganda In Labor Force | Age > 16
COMPARE
Carpatho Rusyn
Immigrants from Uganda
In Labor Force | Age > 16
In Labor Force | Age > 16 Comparison
Carpatho Rusyns
Immigrants from Uganda
65.0%
IN LABOR FORCE | AGE > 16
40.0/ 100
METRIC RATING
184th/ 347
METRIC RANK
67.5%
IN LABOR FORCE | AGE > 16
100.0/ 100
METRIC RATING
22nd/ 347
METRIC RANK
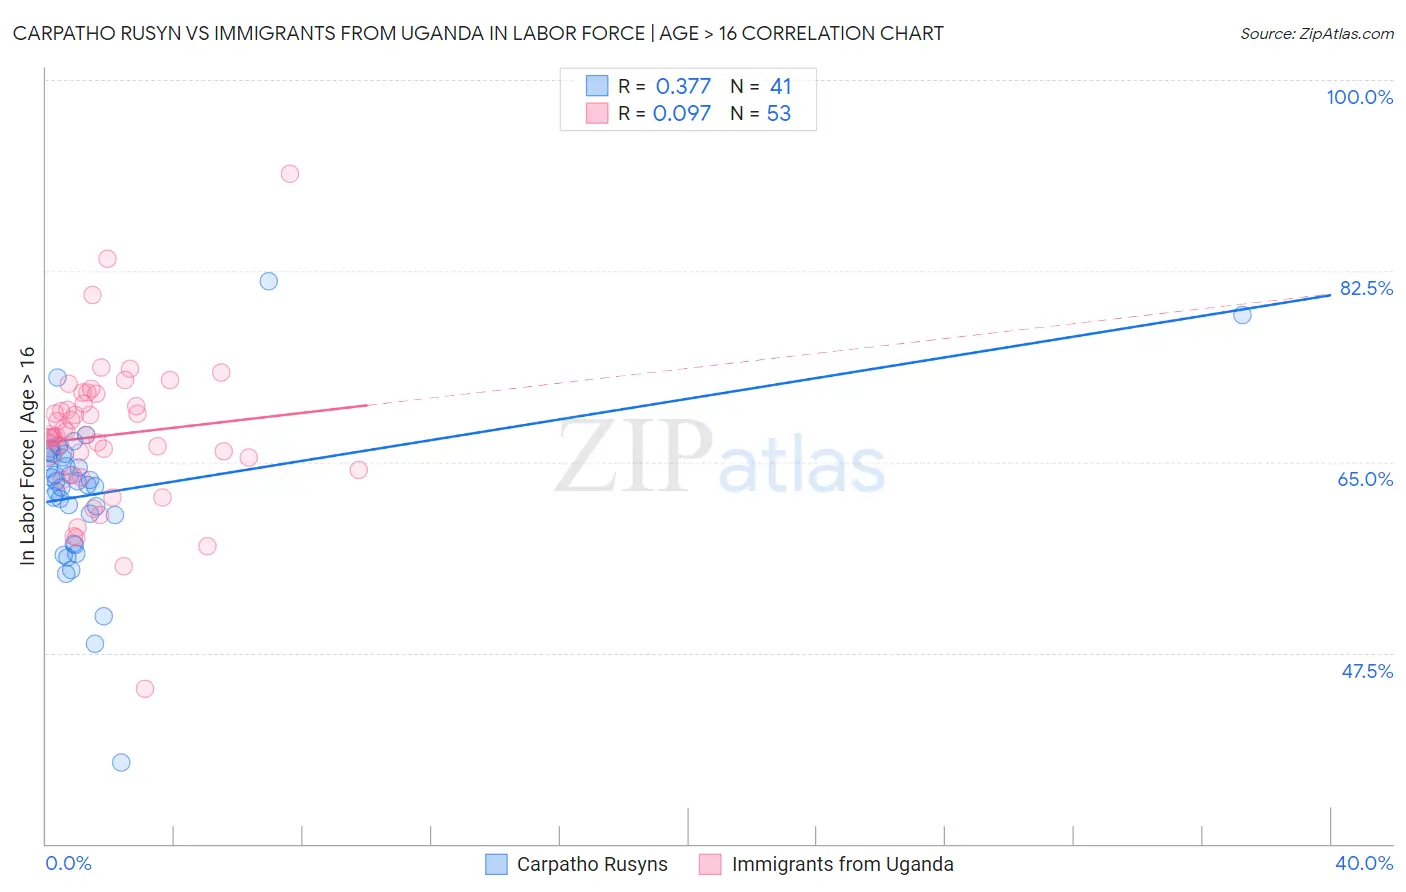
Carpatho Rusyn vs Immigrants from Uganda In Labor Force | Age > 16 Correlation Chart
The statistical analysis conducted on geographies consisting of 58,872,150 people shows a mild positive correlation between the proportion of Carpatho Rusyns and labor force participation rate among population ages 16 and over in the United States with a correlation coefficient (R) of 0.377 and weighted average of 65.0%. Similarly, the statistical analysis conducted on geographies consisting of 125,982,197 people shows a slight positive correlation between the proportion of Immigrants from Uganda and labor force participation rate among population ages 16 and over in the United States with a correlation coefficient (R) of 0.097 and weighted average of 67.5%, a difference of 3.8%.
In Labor Force | Age > 16 Correlation Summary
| Measurement | Carpatho Rusyn | Immigrants from Uganda |
| Minimum | 37.5% | 44.2% |
| Maximum | 81.5% | 91.4% |
| Range | 44.0% | 47.2% |
| Mean | 62.2% | 67.4% |
| Median | 63.2% | 67.4% |
| Interquartile 25% (IQ1) | 58.8% | 64.0% |
| Interquartile 75% (IQ3) | 65.5% | 70.8% |
| Interquartile Range (IQR) | 6.7% | 6.8% |
| Standard Deviation (Sample) | 7.3% | 7.0% |
| Standard Deviation (Population) | 7.2% | 6.9% |
Similar Demographics by In Labor Force | Age > 16
Demographics Similar to Carpatho Rusyns by In Labor Force | Age > 16
In terms of in labor force | age > 16, the demographic groups most similar to Carpatho Rusyns are Syrian (65.0%, a difference of 0.0%), Immigrants from Nicaragua (65.1%, a difference of 0.010%), Soviet Union (65.0%, a difference of 0.010%), Immigrants from Switzerland (65.0%, a difference of 0.020%), and Immigrants from Latvia (65.1%, a difference of 0.030%).
| Demographics | Rating | Rank | In Labor Force | Age > 16 |
| Eastern Europeans | 46.2 /100 | #177 | Average 65.1% |
| Trinidadians and Tobagonians | 45.2 /100 | #178 | Average 65.1% |
| Immigrants | Haiti | 43.3 /100 | #179 | Average 65.1% |
| Immigrants | Latvia | 42.9 /100 | #180 | Average 65.1% |
| Immigrants | Panama | 42.4 /100 | #181 | Average 65.1% |
| Immigrants | Nicaragua | 41.1 /100 | #182 | Average 65.1% |
| Soviet Union | 40.5 /100 | #183 | Average 65.0% |
| Carpatho Rusyns | 40.0 /100 | #184 | Average 65.0% |
| Syrians | 40.0 /100 | #185 | Average 65.0% |
| Immigrants | Switzerland | 38.2 /100 | #186 | Fair 65.0% |
| Immigrants | Croatia | 35.7 /100 | #187 | Fair 65.0% |
| Immigrants | Portugal | 34.8 /100 | #188 | Fair 65.0% |
| Immigrants | Greece | 34.3 /100 | #189 | Fair 65.0% |
| Barbadians | 33.9 /100 | #190 | Fair 65.0% |
| Scandinavians | 33.7 /100 | #191 | Fair 65.0% |
Demographics Similar to Immigrants from Uganda by In Labor Force | Age > 16
In terms of in labor force | age > 16, the demographic groups most similar to Immigrants from Uganda are Tongan (67.5%, a difference of 0.060%), Immigrants from Kenya (67.6%, a difference of 0.080%), Cambodian (67.4%, a difference of 0.12%), Kenyan (67.6%, a difference of 0.13%), and Immigrants from Liberia (67.6%, a difference of 0.16%).
| Demographics | Rating | Rank | In Labor Force | Age > 16 |
| Immigrants | Middle Africa | 100.0 /100 | #15 | Exceptional 67.7% |
| Immigrants | Sudan | 100.0 /100 | #16 | Exceptional 67.7% |
| Immigrants | India | 100.0 /100 | #17 | Exceptional 67.6% |
| Immigrants | Liberia | 100.0 /100 | #18 | Exceptional 67.6% |
| Kenyans | 100.0 /100 | #19 | Exceptional 67.6% |
| Immigrants | Kenya | 100.0 /100 | #20 | Exceptional 67.6% |
| Tongans | 100.0 /100 | #21 | Exceptional 67.5% |
| Immigrants | Uganda | 100.0 /100 | #22 | Exceptional 67.5% |
| Cambodians | 100.0 /100 | #23 | Exceptional 67.4% |
| Ugandans | 100.0 /100 | #24 | Exceptional 67.4% |
| Immigrants | Africa | 100.0 /100 | #25 | Exceptional 67.4% |
| Immigrants | Cabo Verde | 100.0 /100 | #26 | Exceptional 67.3% |
| Zimbabweans | 100.0 /100 | #27 | Exceptional 67.3% |
| Immigrants | Morocco | 100.0 /100 | #28 | Exceptional 67.2% |
| Thais | 100.0 /100 | #29 | Exceptional 67.2% |