Carpatho Rusyn vs Immigrants from Austria In Labor Force | Age > 16
COMPARE
Carpatho Rusyn
Immigrants from Austria
In Labor Force | Age > 16
In Labor Force | Age > 16 Comparison
Carpatho Rusyns
Immigrants from Austria
65.0%
IN LABOR FORCE | AGE > 16
40.0/ 100
METRIC RATING
184th/ 347
METRIC RANK
63.9%
IN LABOR FORCE | AGE > 16
0.1/ 100
METRIC RATING
286th/ 347
METRIC RANK
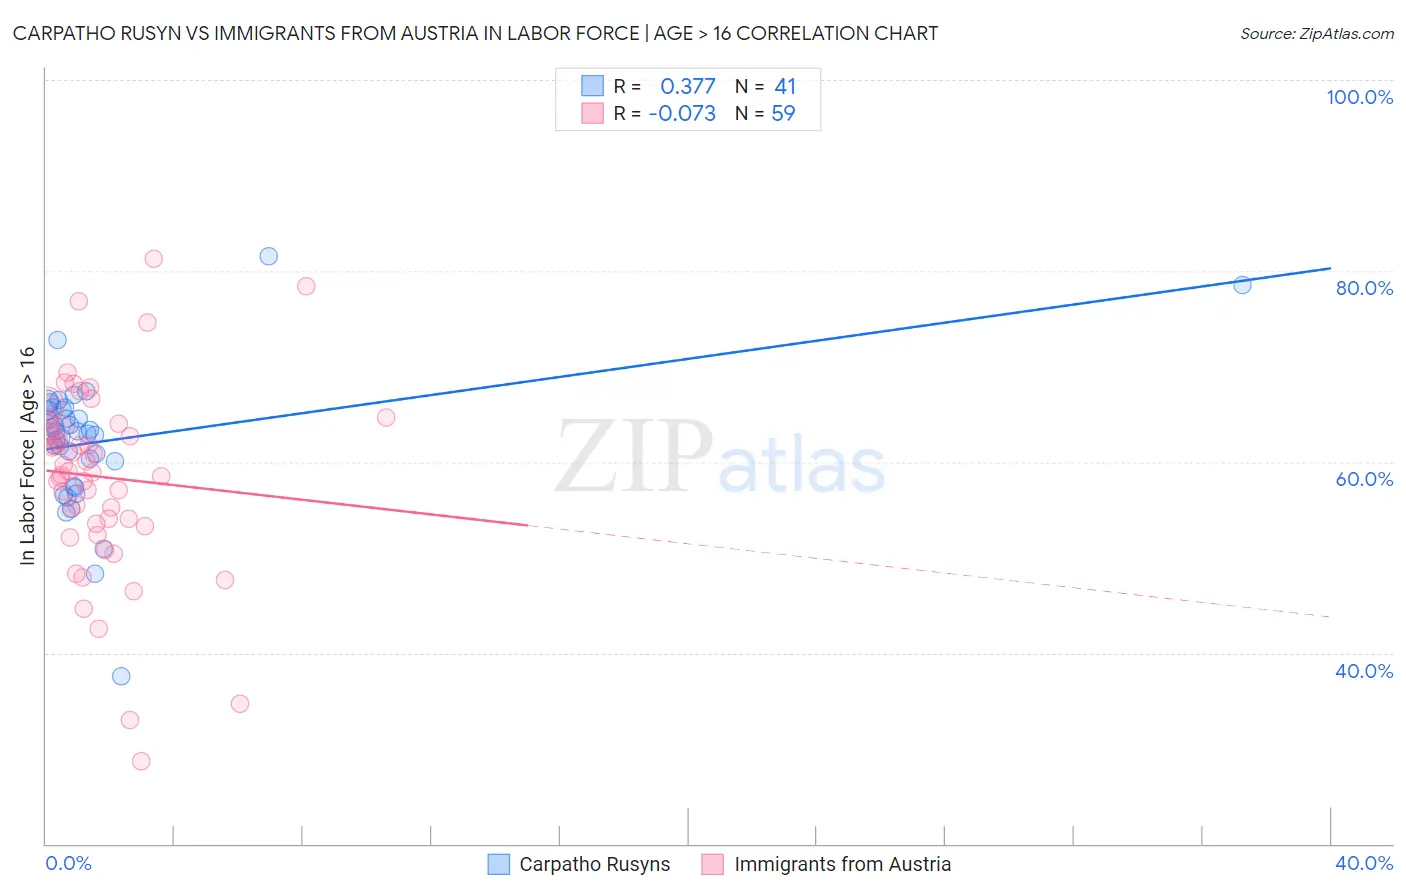
Carpatho Rusyn vs Immigrants from Austria In Labor Force | Age > 16 Correlation Chart
The statistical analysis conducted on geographies consisting of 58,872,150 people shows a mild positive correlation between the proportion of Carpatho Rusyns and labor force participation rate among population ages 16 and over in the United States with a correlation coefficient (R) of 0.377 and weighted average of 65.0%. Similarly, the statistical analysis conducted on geographies consisting of 167,973,659 people shows a slight negative correlation between the proportion of Immigrants from Austria and labor force participation rate among population ages 16 and over in the United States with a correlation coefficient (R) of -0.073 and weighted average of 63.9%, a difference of 1.8%.
In Labor Force | Age > 16 Correlation Summary
| Measurement | Carpatho Rusyn | Immigrants from Austria |
| Minimum | 37.5% | 28.7% |
| Maximum | 81.5% | 81.3% |
| Range | 44.0% | 52.6% |
| Mean | 62.2% | 58.4% |
| Median | 63.2% | 59.0% |
| Interquartile 25% (IQ1) | 58.8% | 53.5% |
| Interquartile 75% (IQ3) | 65.5% | 64.0% |
| Interquartile Range (IQR) | 6.7% | 10.5% |
| Standard Deviation (Sample) | 7.3% | 10.0% |
| Standard Deviation (Population) | 7.2% | 9.9% |
Similar Demographics by In Labor Force | Age > 16
Demographics Similar to Carpatho Rusyns by In Labor Force | Age > 16
In terms of in labor force | age > 16, the demographic groups most similar to Carpatho Rusyns are Syrian (65.0%, a difference of 0.0%), Immigrants from Nicaragua (65.1%, a difference of 0.010%), Soviet Union (65.0%, a difference of 0.010%), Immigrants from Switzerland (65.0%, a difference of 0.020%), and Immigrants from Latvia (65.1%, a difference of 0.030%).
| Demographics | Rating | Rank | In Labor Force | Age > 16 |
| Eastern Europeans | 46.2 /100 | #177 | Average 65.1% |
| Trinidadians and Tobagonians | 45.2 /100 | #178 | Average 65.1% |
| Immigrants | Haiti | 43.3 /100 | #179 | Average 65.1% |
| Immigrants | Latvia | 42.9 /100 | #180 | Average 65.1% |
| Immigrants | Panama | 42.4 /100 | #181 | Average 65.1% |
| Immigrants | Nicaragua | 41.1 /100 | #182 | Average 65.1% |
| Soviet Union | 40.5 /100 | #183 | Average 65.0% |
| Carpatho Rusyns | 40.0 /100 | #184 | Average 65.0% |
| Syrians | 40.0 /100 | #185 | Average 65.0% |
| Immigrants | Switzerland | 38.2 /100 | #186 | Fair 65.0% |
| Immigrants | Croatia | 35.7 /100 | #187 | Fair 65.0% |
| Immigrants | Portugal | 34.8 /100 | #188 | Fair 65.0% |
| Immigrants | Greece | 34.3 /100 | #189 | Fair 65.0% |
| Barbadians | 33.9 /100 | #190 | Fair 65.0% |
| Scandinavians | 33.7 /100 | #191 | Fair 65.0% |
Demographics Similar to Immigrants from Austria by In Labor Force | Age > 16
In terms of in labor force | age > 16, the demographic groups most similar to Immigrants from Austria are Scottish (63.9%, a difference of 0.0%), Slovak (63.9%, a difference of 0.030%), Spanish (63.9%, a difference of 0.050%), French (63.9%, a difference of 0.060%), and Immigrants from Germany (63.9%, a difference of 0.070%).
| Demographics | Rating | Rank | In Labor Force | Age > 16 |
| Welsh | 0.2 /100 | #279 | Tragic 64.0% |
| Immigrants | St. Vincent and the Grenadines | 0.2 /100 | #280 | Tragic 64.0% |
| French Canadians | 0.2 /100 | #281 | Tragic 64.0% |
| Immigrants | Guyana | 0.2 /100 | #282 | Tragic 64.0% |
| Immigrants | Germany | 0.1 /100 | #283 | Tragic 63.9% |
| French | 0.1 /100 | #284 | Tragic 63.9% |
| Slovaks | 0.1 /100 | #285 | Tragic 63.9% |
| Immigrants | Austria | 0.1 /100 | #286 | Tragic 63.9% |
| Scottish | 0.1 /100 | #287 | Tragic 63.9% |
| Spanish | 0.1 /100 | #288 | Tragic 63.9% |
| Celtics | 0.1 /100 | #289 | Tragic 63.8% |
| Hungarians | 0.1 /100 | #290 | Tragic 63.8% |
| Nepalese | 0.1 /100 | #291 | Tragic 63.8% |
| Spanish American Indians | 0.1 /100 | #292 | Tragic 63.8% |
| English | 0.1 /100 | #293 | Tragic 63.7% |