Immigrants from Uganda vs Immigrants from Korea In Labor Force | Age 35-44
COMPARE
Immigrants from Uganda
Immigrants from Korea
In Labor Force | Age 35-44
In Labor Force | Age 35-44 Comparison
Immigrants from Uganda
Immigrants from Korea
85.0%
IN LABOR FORCE | AGE 35-44
99.3/ 100
METRIC RATING
63rd/ 347
METRIC RANK
84.6%
IN LABOR FORCE | AGE 35-44
88.2/ 100
METRIC RATING
134th/ 347
METRIC RANK
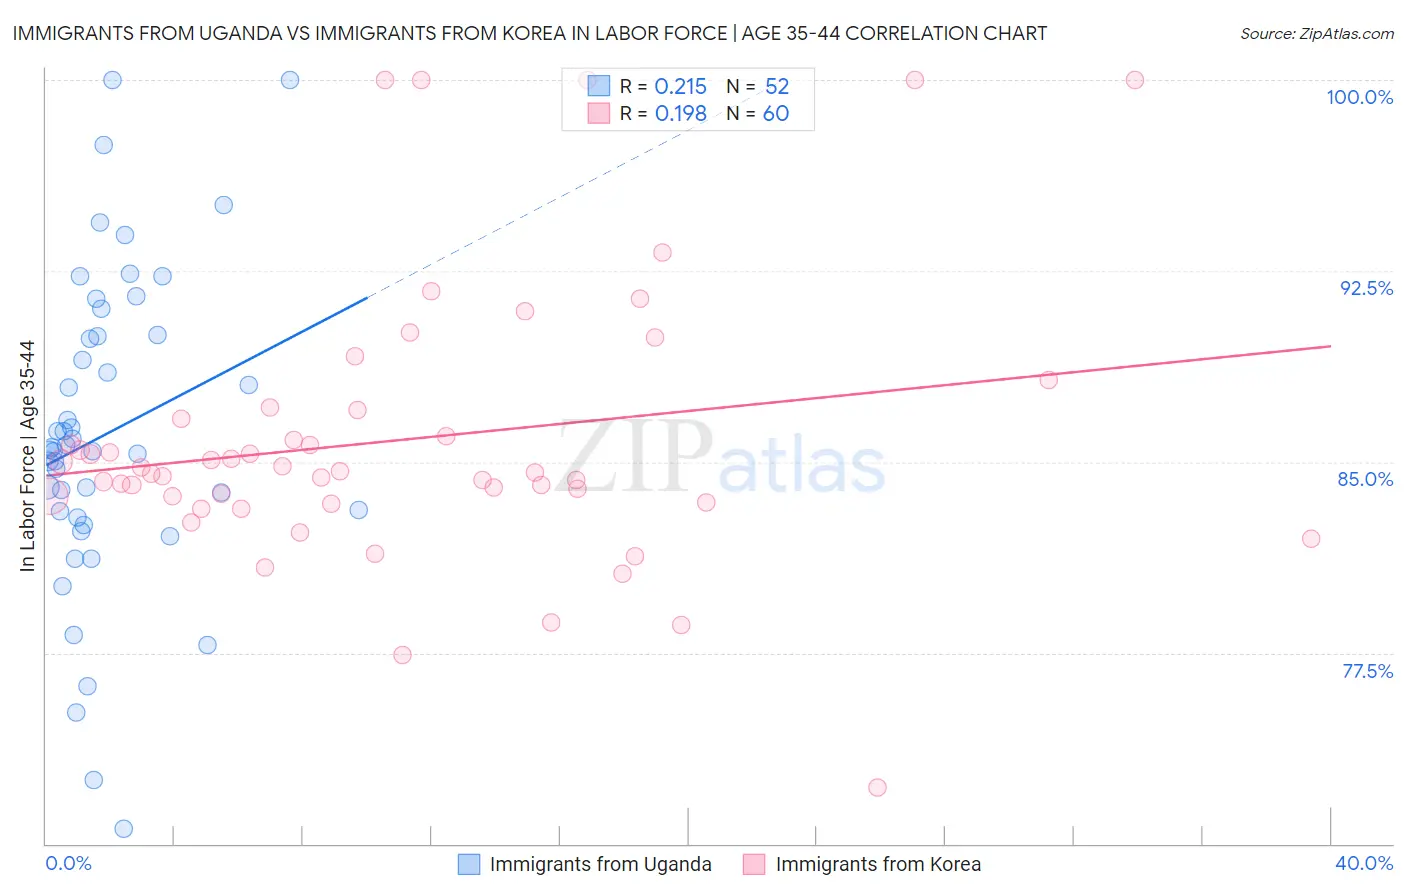
Immigrants from Uganda vs Immigrants from Korea In Labor Force | Age 35-44 Correlation Chart
The statistical analysis conducted on geographies consisting of 125,971,479 people shows a weak positive correlation between the proportion of Immigrants from Uganda and labor force participation rate among population between the ages 35 and 44 in the United States with a correlation coefficient (R) of 0.215 and weighted average of 85.0%. Similarly, the statistical analysis conducted on geographies consisting of 416,059,040 people shows a poor positive correlation between the proportion of Immigrants from Korea and labor force participation rate among population between the ages 35 and 44 in the United States with a correlation coefficient (R) of 0.198 and weighted average of 84.6%, a difference of 0.47%.
In Labor Force | Age 35-44 Correlation Summary
| Measurement | Immigrants from Uganda | Immigrants from Korea |
| Minimum | 70.6% | 72.2% |
| Maximum | 100.0% | 100.0% |
| Range | 29.4% | 27.8% |
| Mean | 86.1% | 85.9% |
| Median | 85.5% | 84.6% |
| Interquartile 25% (IQ1) | 82.9% | 83.5% |
| Interquartile 75% (IQ3) | 90.0% | 86.9% |
| Interquartile Range (IQR) | 7.0% | 3.3% |
| Standard Deviation (Sample) | 6.2% | 5.5% |
| Standard Deviation (Population) | 6.1% | 5.4% |
Similar Demographics by In Labor Force | Age 35-44
Demographics Similar to Immigrants from Uganda by In Labor Force | Age 35-44
In terms of in labor force | age 35-44, the demographic groups most similar to Immigrants from Uganda are Immigrants from Moldova (85.0%, a difference of 0.0%), Immigrants from Latvia (85.0%, a difference of 0.010%), Swedish (85.0%, a difference of 0.010%), Immigrants from Brazil (85.0%, a difference of 0.020%), and Slovak (85.1%, a difference of 0.030%).
| Demographics | Rating | Rank | In Labor Force | Age 35-44 |
| Immigrants | Croatia | 99.5 /100 | #56 | Exceptional 85.1% |
| Chinese | 99.4 /100 | #57 | Exceptional 85.1% |
| Slovaks | 99.4 /100 | #58 | Exceptional 85.1% |
| Serbians | 99.4 /100 | #59 | Exceptional 85.1% |
| Albanians | 99.4 /100 | #60 | Exceptional 85.1% |
| Immigrants | Latvia | 99.3 /100 | #61 | Exceptional 85.0% |
| Immigrants | Moldova | 99.3 /100 | #62 | Exceptional 85.0% |
| Immigrants | Uganda | 99.3 /100 | #63 | Exceptional 85.0% |
| Swedes | 99.2 /100 | #64 | Exceptional 85.0% |
| Immigrants | Brazil | 99.2 /100 | #65 | Exceptional 85.0% |
| Immigrants | Haiti | 99.1 /100 | #66 | Exceptional 85.0% |
| Immigrants | Italy | 99.1 /100 | #67 | Exceptional 85.0% |
| Italians | 99.1 /100 | #68 | Exceptional 85.0% |
| Sudanese | 99.0 /100 | #69 | Exceptional 85.0% |
| Brazilians | 99.0 /100 | #70 | Exceptional 85.0% |
Demographics Similar to Immigrants from Korea by In Labor Force | Age 35-44
In terms of in labor force | age 35-44, the demographic groups most similar to Immigrants from Korea are Argentinean (84.6%, a difference of 0.0%), Immigrants from Malaysia (84.6%, a difference of 0.010%), Palestinian (84.7%, a difference of 0.020%), Bhutanese (84.7%, a difference of 0.020%), and Immigrants from Scotland (84.7%, a difference of 0.020%).
| Demographics | Rating | Rank | In Labor Force | Age 35-44 |
| Immigrants | Spain | 90.6 /100 | #127 | Exceptional 84.7% |
| Immigrants | Ghana | 90.4 /100 | #128 | Exceptional 84.7% |
| Palestinians | 89.7 /100 | #129 | Excellent 84.7% |
| Bhutanese | 89.7 /100 | #130 | Excellent 84.7% |
| Immigrants | Scotland | 89.6 /100 | #131 | Excellent 84.7% |
| Austrians | 89.4 /100 | #132 | Excellent 84.7% |
| Argentineans | 88.4 /100 | #133 | Excellent 84.6% |
| Immigrants | Korea | 88.2 /100 | #134 | Excellent 84.6% |
| Immigrants | Malaysia | 87.5 /100 | #135 | Excellent 84.6% |
| Afghans | 86.3 /100 | #136 | Excellent 84.6% |
| Immigrants | Chile | 84.6 /100 | #137 | Excellent 84.6% |
| Czechoslovakians | 82.6 /100 | #138 | Excellent 84.6% |
| Immigrants | Zaire | 82.5 /100 | #139 | Excellent 84.6% |
| Immigrants | Japan | 81.4 /100 | #140 | Excellent 84.6% |
| Immigrants | Belgium | 80.8 /100 | #141 | Excellent 84.6% |