Canadian vs Welsh In Labor Force | Age 35-44
COMPARE
Canadian
Welsh
In Labor Force | Age 35-44
In Labor Force | Age 35-44 Comparison
Canadians
Welsh
84.2%
IN LABOR FORCE | AGE 35-44
19.9/ 100
METRIC RATING
204th/ 347
METRIC RANK
84.0%
IN LABOR FORCE | AGE 35-44
5.3/ 100
METRIC RATING
228th/ 347
METRIC RANK
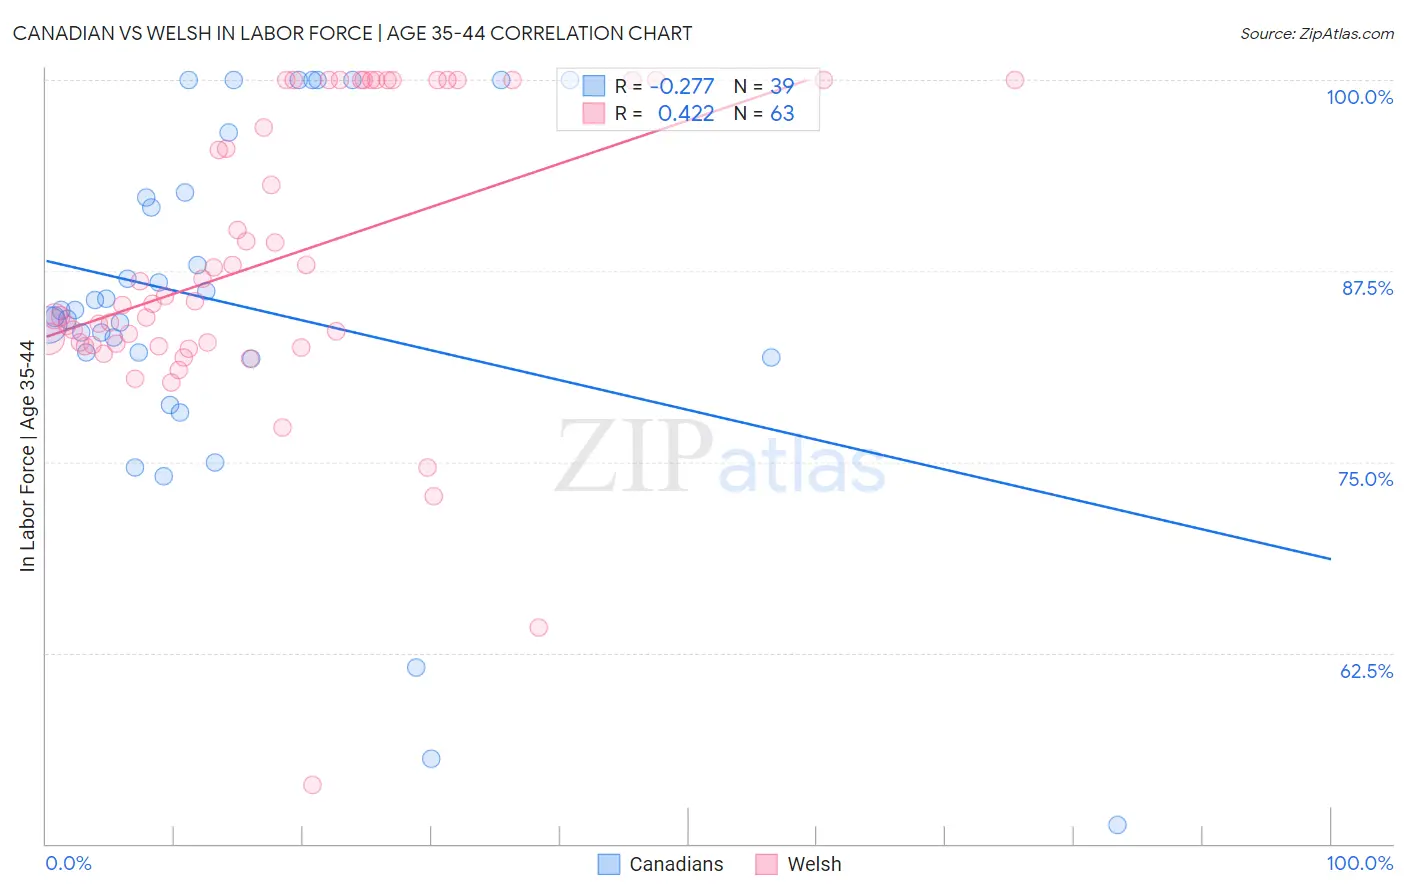
Canadian vs Welsh In Labor Force | Age 35-44 Correlation Chart
The statistical analysis conducted on geographies consisting of 437,310,598 people shows a weak negative correlation between the proportion of Canadians and labor force participation rate among population between the ages 35 and 44 in the United States with a correlation coefficient (R) of -0.277 and weighted average of 84.2%. Similarly, the statistical analysis conducted on geographies consisting of 528,172,849 people shows a moderate positive correlation between the proportion of Welsh and labor force participation rate among population between the ages 35 and 44 in the United States with a correlation coefficient (R) of 0.422 and weighted average of 84.0%, a difference of 0.24%.
In Labor Force | Age 35-44 Correlation Summary
| Measurement | Canadian | Welsh |
| Minimum | 51.2% | 53.9% |
| Maximum | 100.0% | 100.0% |
| Range | 48.8% | 46.1% |
| Mean | 85.3% | 88.2% |
| Median | 84.9% | 85.5% |
| Interquartile 25% (IQ1) | 81.8% | 82.7% |
| Interquartile 75% (IQ3) | 92.7% | 100.0% |
| Interquartile Range (IQR) | 10.9% | 17.3% |
| Standard Deviation (Sample) | 11.6% | 9.7% |
| Standard Deviation (Population) | 11.5% | 9.6% |
Similar Demographics by In Labor Force | Age 35-44
Demographics Similar to Canadians by In Labor Force | Age 35-44
In terms of in labor force | age 35-44, the demographic groups most similar to Canadians are Immigrants from Canada (84.2%, a difference of 0.0%), Immigrants from Costa Rica (84.2%, a difference of 0.0%), Laotian (84.2%, a difference of 0.010%), Immigrants from South Eastern Asia (84.2%, a difference of 0.020%), and Immigrants from North America (84.2%, a difference of 0.020%).
| Demographics | Rating | Rank | In Labor Force | Age 35-44 |
| Immigrants | Western Europe | 24.7 /100 | #197 | Fair 84.2% |
| Ecuadorians | 24.0 /100 | #198 | Fair 84.2% |
| Syrians | 23.2 /100 | #199 | Fair 84.2% |
| Moroccans | 23.2 /100 | #200 | Fair 84.2% |
| British | 23.0 /100 | #201 | Fair 84.2% |
| Immigrants | Uzbekistan | 22.8 /100 | #202 | Fair 84.2% |
| Immigrants | South Eastern Asia | 22.4 /100 | #203 | Fair 84.2% |
| Canadians | 19.9 /100 | #204 | Poor 84.2% |
| Immigrants | Canada | 19.6 /100 | #205 | Poor 84.2% |
| Immigrants | Costa Rica | 19.5 /100 | #206 | Poor 84.2% |
| Laotians | 19.0 /100 | #207 | Poor 84.2% |
| Immigrants | North America | 18.1 /100 | #208 | Poor 84.2% |
| Swiss | 17.4 /100 | #209 | Poor 84.2% |
| New Zealanders | 16.2 /100 | #210 | Poor 84.1% |
| Immigrants | Ecuador | 15.2 /100 | #211 | Poor 84.1% |
Demographics Similar to Welsh by In Labor Force | Age 35-44
In terms of in labor force | age 35-44, the demographic groups most similar to Welsh are Panamanian (84.0%, a difference of 0.0%), British West Indian (84.0%, a difference of 0.0%), U.S. Virgin Islander (84.0%, a difference of 0.020%), Immigrants from Burma/Myanmar (84.0%, a difference of 0.020%), and Immigrants from Thailand (84.0%, a difference of 0.020%).
| Demographics | Rating | Rank | In Labor Force | Age 35-44 |
| Icelanders | 6.7 /100 | #221 | Tragic 84.0% |
| Assyrians/Chaldeans/Syriacs | 6.6 /100 | #222 | Tragic 84.0% |
| Immigrants | Panama | 6.4 /100 | #223 | Tragic 84.0% |
| U.S. Virgin Islanders | 6.1 /100 | #224 | Tragic 84.0% |
| Immigrants | Burma/Myanmar | 6.1 /100 | #225 | Tragic 84.0% |
| Panamanians | 5.4 /100 | #226 | Tragic 84.0% |
| British West Indians | 5.3 /100 | #227 | Tragic 84.0% |
| Welsh | 5.3 /100 | #228 | Tragic 84.0% |
| Immigrants | Thailand | 4.7 /100 | #229 | Tragic 84.0% |
| Immigrants | Iraq | 3.7 /100 | #230 | Tragic 83.9% |
| Scottish | 3.2 /100 | #231 | Tragic 83.9% |
| Native Hawaiians | 3.0 /100 | #232 | Tragic 83.9% |
| Immigrants | Germany | 2.8 /100 | #233 | Tragic 83.9% |
| Immigrants | Oceania | 2.6 /100 | #234 | Tragic 83.9% |
| Immigrants | Syria | 2.5 /100 | #235 | Tragic 83.9% |