Hawaiian vs Immigrants from Korea In Labor Force | Age 35-44
COMPARE
Hawaiian
Immigrants from Korea
In Labor Force | Age 35-44
In Labor Force | Age 35-44 Comparison
Hawaiians
Immigrants from Korea
83.2%
IN LABOR FORCE | AGE 35-44
0.0/ 100
METRIC RATING
275th/ 347
METRIC RANK
84.6%
IN LABOR FORCE | AGE 35-44
88.2/ 100
METRIC RATING
134th/ 347
METRIC RANK
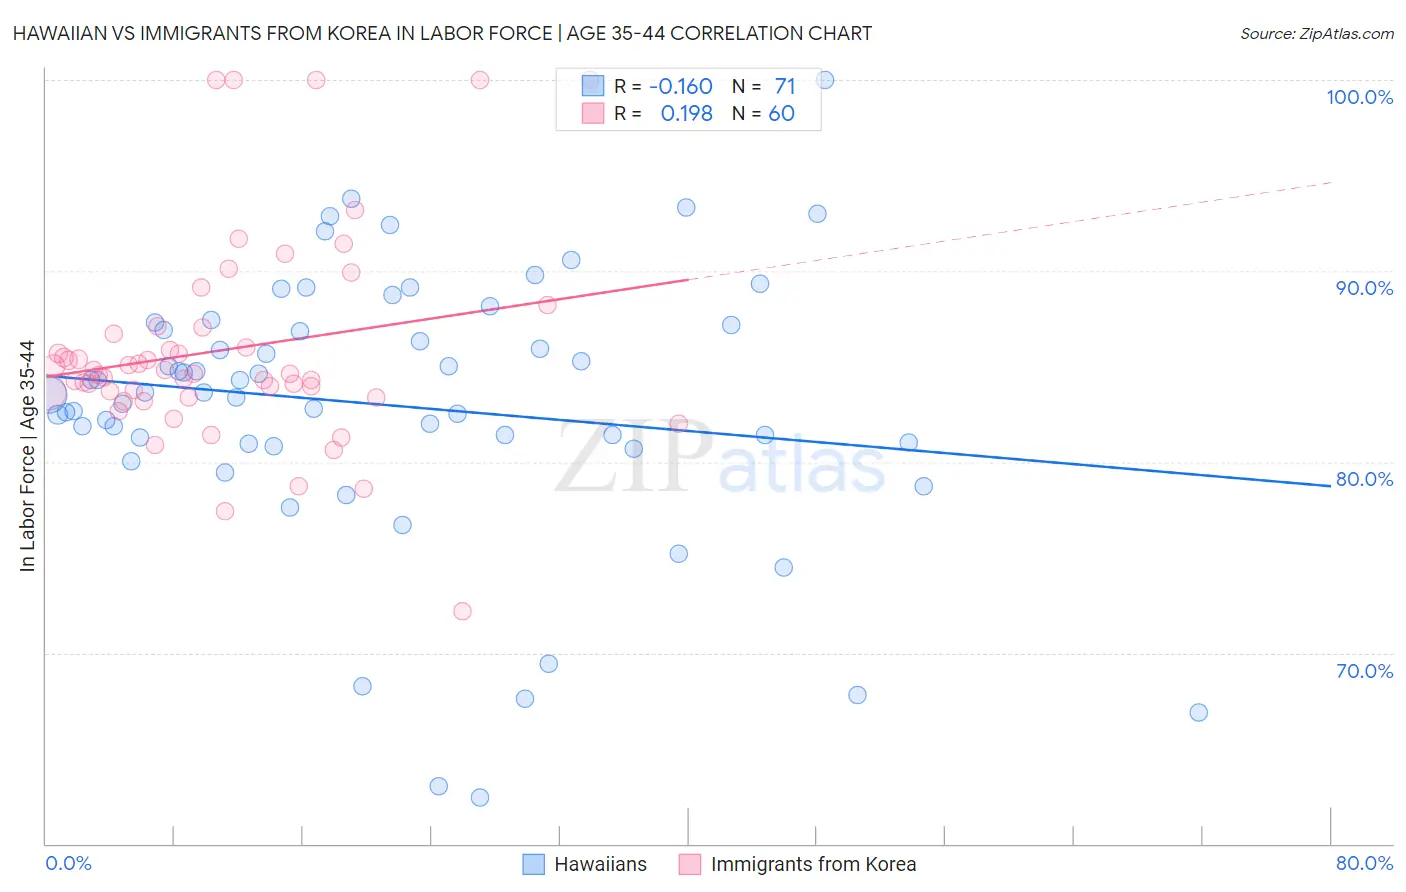
Hawaiian vs Immigrants from Korea In Labor Force | Age 35-44 Correlation Chart
The statistical analysis conducted on geographies consisting of 327,486,106 people shows a poor negative correlation between the proportion of Hawaiians and labor force participation rate among population between the ages 35 and 44 in the United States with a correlation coefficient (R) of -0.160 and weighted average of 83.2%. Similarly, the statistical analysis conducted on geographies consisting of 416,059,040 people shows a poor positive correlation between the proportion of Immigrants from Korea and labor force participation rate among population between the ages 35 and 44 in the United States with a correlation coefficient (R) of 0.198 and weighted average of 84.6%, a difference of 1.7%.
In Labor Force | Age 35-44 Correlation Summary
| Measurement | Hawaiian | Immigrants from Korea |
| Minimum | 62.4% | 72.2% |
| Maximum | 100.0% | 100.0% |
| Range | 37.6% | 27.8% |
| Mean | 83.0% | 85.9% |
| Median | 83.6% | 84.6% |
| Interquartile 25% (IQ1) | 80.9% | 83.5% |
| Interquartile 75% (IQ3) | 87.2% | 86.9% |
| Interquartile Range (IQR) | 6.3% | 3.3% |
| Standard Deviation (Sample) | 7.2% | 5.5% |
| Standard Deviation (Population) | 7.1% | 5.4% |
Similar Demographics by In Labor Force | Age 35-44
Demographics Similar to Hawaiians by In Labor Force | Age 35-44
In terms of in labor force | age 35-44, the demographic groups most similar to Hawaiians are Delaware (83.2%, a difference of 0.010%), Nonimmigrants (83.2%, a difference of 0.020%), Samoan (83.2%, a difference of 0.020%), Immigrants from Fiji (83.2%, a difference of 0.030%), and Spanish (83.2%, a difference of 0.030%).
| Demographics | Rating | Rank | In Labor Force | Age 35-44 |
| Hondurans | 0.1 /100 | #268 | Tragic 83.4% |
| Immigrants | Grenada | 0.1 /100 | #269 | Tragic 83.3% |
| Immigrants | Honduras | 0.0 /100 | #270 | Tragic 83.3% |
| French American Indians | 0.0 /100 | #271 | Tragic 83.2% |
| Immigrants | Fiji | 0.0 /100 | #272 | Tragic 83.2% |
| Spanish | 0.0 /100 | #273 | Tragic 83.2% |
| Immigrants | Nonimmigrants | 0.0 /100 | #274 | Tragic 83.2% |
| Hawaiians | 0.0 /100 | #275 | Tragic 83.2% |
| Delaware | 0.0 /100 | #276 | Tragic 83.2% |
| Samoans | 0.0 /100 | #277 | Tragic 83.2% |
| Belizeans | 0.0 /100 | #278 | Tragic 83.1% |
| Immigrants | Micronesia | 0.0 /100 | #279 | Tragic 83.1% |
| Dominicans | 0.0 /100 | #280 | Tragic 83.1% |
| Guatemalans | 0.0 /100 | #281 | Tragic 83.0% |
| Osage | 0.0 /100 | #282 | Tragic 82.9% |
Demographics Similar to Immigrants from Korea by In Labor Force | Age 35-44
In terms of in labor force | age 35-44, the demographic groups most similar to Immigrants from Korea are Argentinean (84.6%, a difference of 0.0%), Immigrants from Malaysia (84.6%, a difference of 0.010%), Palestinian (84.7%, a difference of 0.020%), Bhutanese (84.7%, a difference of 0.020%), and Immigrants from Scotland (84.7%, a difference of 0.020%).
| Demographics | Rating | Rank | In Labor Force | Age 35-44 |
| Immigrants | Spain | 90.6 /100 | #127 | Exceptional 84.7% |
| Immigrants | Ghana | 90.4 /100 | #128 | Exceptional 84.7% |
| Palestinians | 89.7 /100 | #129 | Excellent 84.7% |
| Bhutanese | 89.7 /100 | #130 | Excellent 84.7% |
| Immigrants | Scotland | 89.6 /100 | #131 | Excellent 84.7% |
| Austrians | 89.4 /100 | #132 | Excellent 84.7% |
| Argentineans | 88.4 /100 | #133 | Excellent 84.6% |
| Immigrants | Korea | 88.2 /100 | #134 | Excellent 84.6% |
| Immigrants | Malaysia | 87.5 /100 | #135 | Excellent 84.6% |
| Afghans | 86.3 /100 | #136 | Excellent 84.6% |
| Immigrants | Chile | 84.6 /100 | #137 | Excellent 84.6% |
| Czechoslovakians | 82.6 /100 | #138 | Excellent 84.6% |
| Immigrants | Zaire | 82.5 /100 | #139 | Excellent 84.6% |
| Immigrants | Japan | 81.4 /100 | #140 | Excellent 84.6% |
| Immigrants | Belgium | 80.8 /100 | #141 | Excellent 84.6% |