Canadian vs Pima In Labor Force | Age 35-44
COMPARE
Canadian
Pima
In Labor Force | Age 35-44
In Labor Force | Age 35-44 Comparison
Canadians
Pima
84.2%
IN LABOR FORCE | AGE 35-44
19.9/ 100
METRIC RATING
204th/ 347
METRIC RANK
74.8%
IN LABOR FORCE | AGE 35-44
0.0/ 100
METRIC RATING
344th/ 347
METRIC RANK
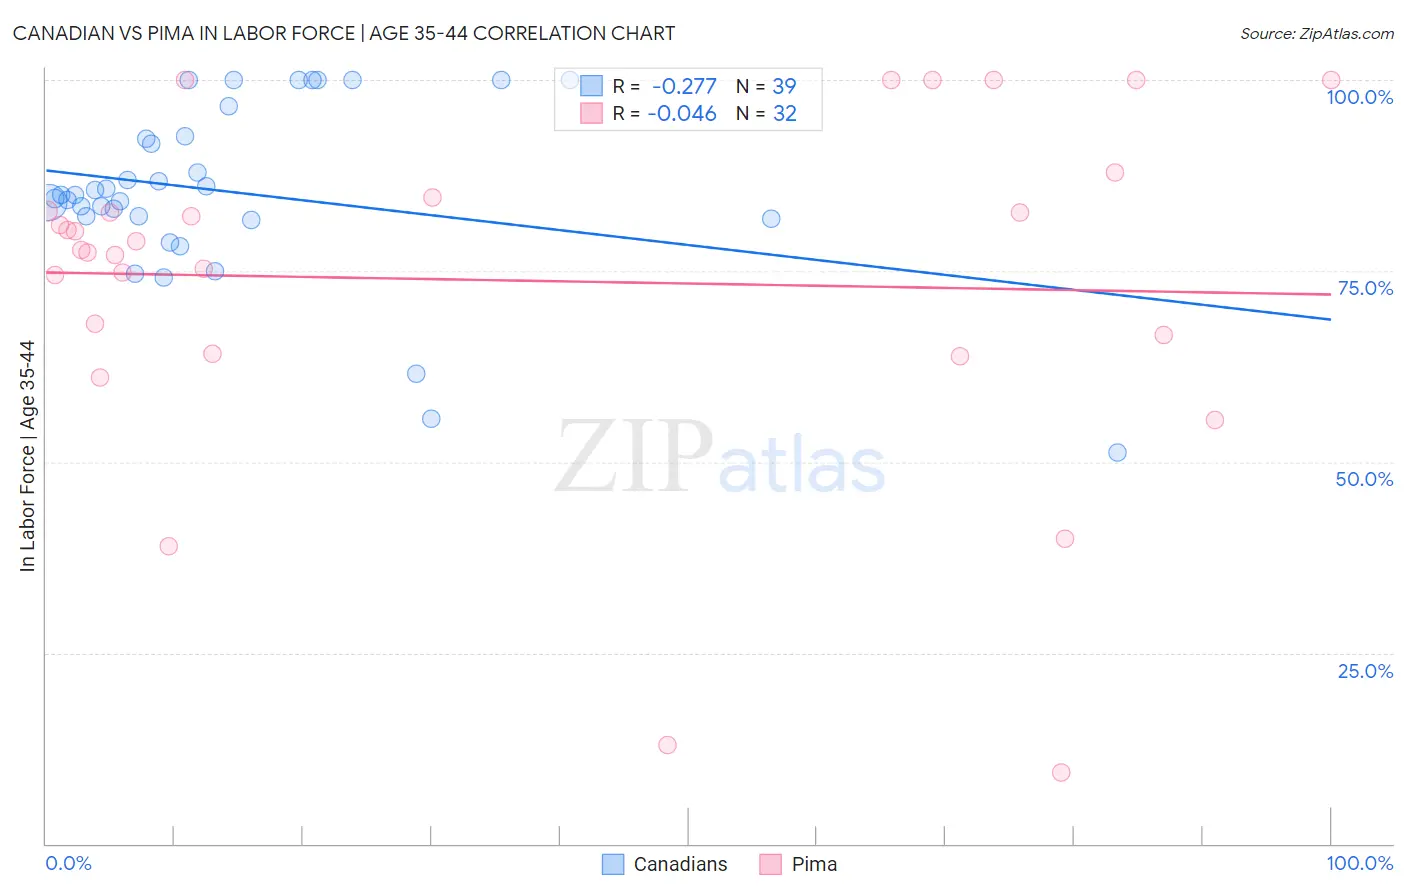
Canadian vs Pima In Labor Force | Age 35-44 Correlation Chart
The statistical analysis conducted on geographies consisting of 437,310,598 people shows a weak negative correlation between the proportion of Canadians and labor force participation rate among population between the ages 35 and 44 in the United States with a correlation coefficient (R) of -0.277 and weighted average of 84.2%. Similarly, the statistical analysis conducted on geographies consisting of 61,535,254 people shows no correlation between the proportion of Pima and labor force participation rate among population between the ages 35 and 44 in the United States with a correlation coefficient (R) of -0.046 and weighted average of 74.8%, a difference of 12.5%.
In Labor Force | Age 35-44 Correlation Summary
| Measurement | Canadian | Pima |
| Minimum | 51.2% | 9.3% |
| Maximum | 100.0% | 100.0% |
| Range | 48.8% | 90.7% |
| Mean | 85.3% | 73.8% |
| Median | 84.9% | 78.3% |
| Interquartile 25% (IQ1) | 81.8% | 65.4% |
| Interquartile 75% (IQ3) | 92.7% | 83.7% |
| Interquartile Range (IQR) | 10.9% | 18.4% |
| Standard Deviation (Sample) | 11.6% | 22.7% |
| Standard Deviation (Population) | 11.5% | 22.3% |
Similar Demographics by In Labor Force | Age 35-44
Demographics Similar to Canadians by In Labor Force | Age 35-44
In terms of in labor force | age 35-44, the demographic groups most similar to Canadians are Immigrants from Canada (84.2%, a difference of 0.0%), Immigrants from Costa Rica (84.2%, a difference of 0.0%), Laotian (84.2%, a difference of 0.010%), Immigrants from South Eastern Asia (84.2%, a difference of 0.020%), and Immigrants from North America (84.2%, a difference of 0.020%).
| Demographics | Rating | Rank | In Labor Force | Age 35-44 |
| Immigrants | Western Europe | 24.7 /100 | #197 | Fair 84.2% |
| Ecuadorians | 24.0 /100 | #198 | Fair 84.2% |
| Syrians | 23.2 /100 | #199 | Fair 84.2% |
| Moroccans | 23.2 /100 | #200 | Fair 84.2% |
| British | 23.0 /100 | #201 | Fair 84.2% |
| Immigrants | Uzbekistan | 22.8 /100 | #202 | Fair 84.2% |
| Immigrants | South Eastern Asia | 22.4 /100 | #203 | Fair 84.2% |
| Canadians | 19.9 /100 | #204 | Poor 84.2% |
| Immigrants | Canada | 19.6 /100 | #205 | Poor 84.2% |
| Immigrants | Costa Rica | 19.5 /100 | #206 | Poor 84.2% |
| Laotians | 19.0 /100 | #207 | Poor 84.2% |
| Immigrants | North America | 18.1 /100 | #208 | Poor 84.2% |
| Swiss | 17.4 /100 | #209 | Poor 84.2% |
| New Zealanders | 16.2 /100 | #210 | Poor 84.1% |
| Immigrants | Ecuador | 15.2 /100 | #211 | Poor 84.1% |
Demographics Similar to Pima by In Labor Force | Age 35-44
In terms of in labor force | age 35-44, the demographic groups most similar to Pima are Yuman (74.7%, a difference of 0.13%), Tohono O'odham (74.1%, a difference of 0.96%), Navajo (73.8%, a difference of 1.3%), Immigrants from Yemen (76.3%, a difference of 1.9%), and Crow (76.5%, a difference of 2.2%).
| Demographics | Rating | Rank | In Labor Force | Age 35-44 |
| Kiowa | 0.0 /100 | #333 | Tragic 79.2% |
| Yakama | 0.0 /100 | #334 | Tragic 79.0% |
| Natives/Alaskans | 0.0 /100 | #335 | Tragic 78.9% |
| Arapaho | 0.0 /100 | #336 | Tragic 78.1% |
| Apache | 0.0 /100 | #337 | Tragic 77.9% |
| Pueblo | 0.0 /100 | #338 | Tragic 77.4% |
| Yup'ik | 0.0 /100 | #339 | Tragic 77.3% |
| Lumbee | 0.0 /100 | #340 | Tragic 77.0% |
| Hopi | 0.0 /100 | #341 | Tragic 77.0% |
| Crow | 0.0 /100 | #342 | Tragic 76.5% |
| Immigrants | Yemen | 0.0 /100 | #343 | Tragic 76.3% |
| Pima | 0.0 /100 | #344 | Tragic 74.8% |
| Yuman | 0.0 /100 | #345 | Tragic 74.7% |
| Tohono O'odham | 0.0 /100 | #346 | Tragic 74.1% |
| Navajo | 0.0 /100 | #347 | Tragic 73.8% |