Bulgarian vs Okinawan Householder Income Ages 45 - 64 years
COMPARE
Bulgarian
Okinawan
Householder Income Ages 45 - 64 years
Householder Income Ages 45 - 64 years Comparison
Bulgarians
Okinawans
$113,883
HOUSEHOLDER INCOME AGES 45 - 64 YEARS
99.9/ 100
METRIC RATING
44th/ 347
METRIC RANK
$124,796
HOUSEHOLDER INCOME AGES 45 - 64 YEARS
100.0/ 100
METRIC RATING
9th/ 347
METRIC RANK
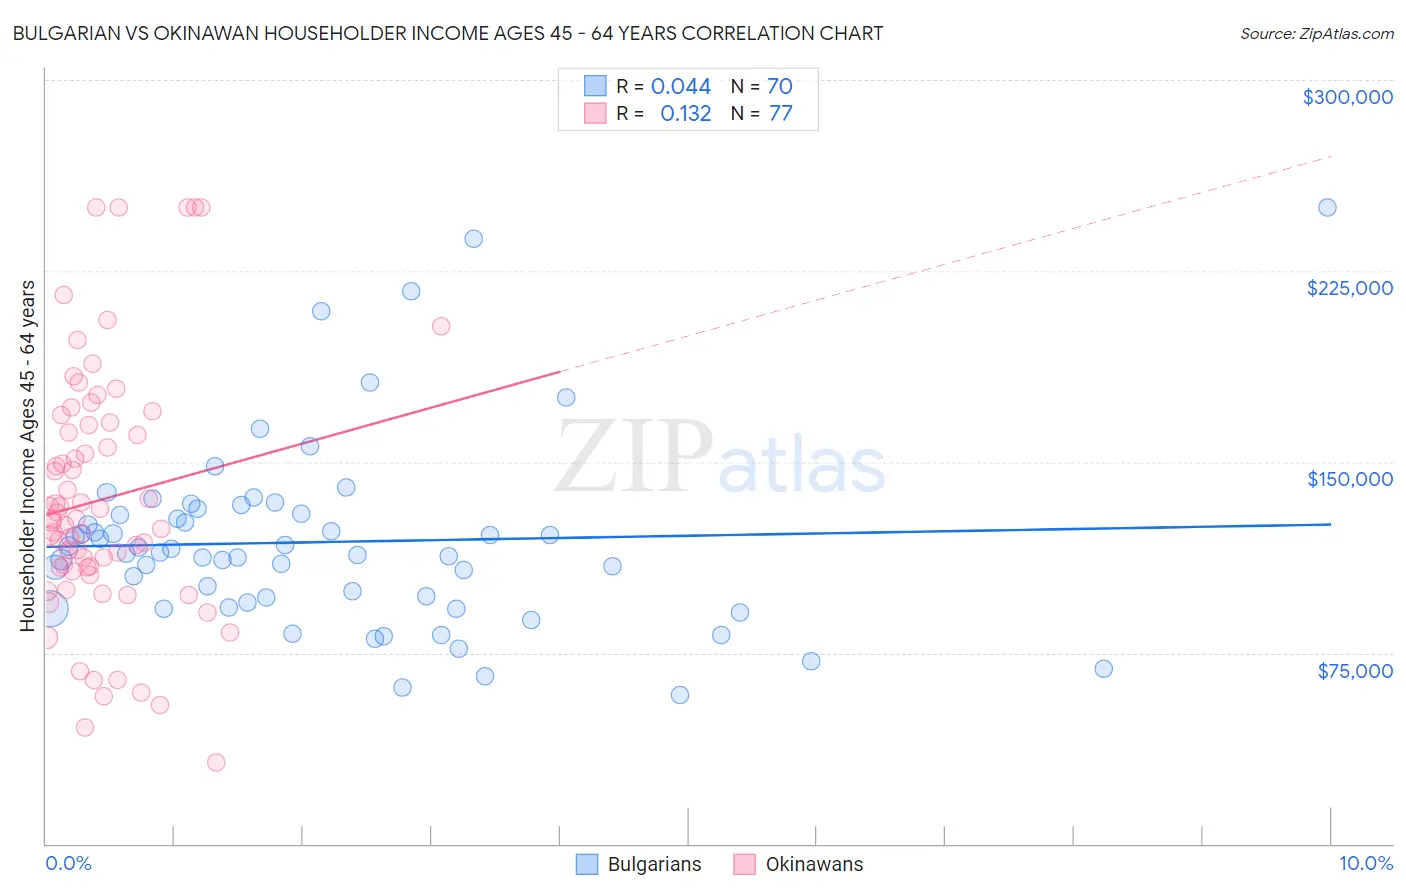
Bulgarian vs Okinawan Householder Income Ages 45 - 64 years Correlation Chart
The statistical analysis conducted on geographies consisting of 205,498,500 people shows no correlation between the proportion of Bulgarians and household income with householder between the ages 45 and 64 in the United States with a correlation coefficient (R) of 0.044 and weighted average of $113,883. Similarly, the statistical analysis conducted on geographies consisting of 73,700,687 people shows a poor positive correlation between the proportion of Okinawans and household income with householder between the ages 45 and 64 in the United States with a correlation coefficient (R) of 0.132 and weighted average of $124,796, a difference of 9.6%.
Householder Income Ages 45 - 64 years Correlation Summary
| Measurement | Bulgarian | Okinawan |
| Minimum | $58,365 | $31,848 |
| Maximum | $250,001 | $250,001 |
| Range | $191,636 | $218,153 |
| Mean | $118,506 | $135,211 |
| Median | $114,293 | $127,491 |
| Interquartile 25% (IQ1) | $94,899 | $107,731 |
| Interquartile 75% (IQ3) | $129,526 | $164,928 |
| Interquartile Range (IQR) | $34,627 | $57,197 |
| Standard Deviation (Sample) | $36,891 | $49,050 |
| Standard Deviation (Population) | $36,627 | $48,731 |
Similar Demographics by Householder Income Ages 45 - 64 years
Demographics Similar to Bulgarians by Householder Income Ages 45 - 64 years
In terms of householder income ages 45 - 64 years, the demographic groups most similar to Bulgarians are Immigrants from France ($113,680, a difference of 0.18%), Israeli ($114,186, a difference of 0.27%), Immigrants from Greece ($113,548, a difference of 0.29%), Estonian ($114,220, a difference of 0.30%), and Australian ($113,533, a difference of 0.31%).
| Demographics | Rating | Rank | Householder Income Ages 45 - 64 years |
| Maltese | 99.9 /100 | #37 | Exceptional $114,754 |
| Immigrants | Pakistan | 99.9 /100 | #38 | Exceptional $114,434 |
| Immigrants | Turkey | 99.9 /100 | #39 | Exceptional $114,407 |
| Cambodians | 99.9 /100 | #40 | Exceptional $114,342 |
| Immigrants | Lithuania | 99.9 /100 | #41 | Exceptional $114,336 |
| Estonians | 99.9 /100 | #42 | Exceptional $114,220 |
| Israelis | 99.9 /100 | #43 | Exceptional $114,186 |
| Bulgarians | 99.9 /100 | #44 | Exceptional $113,883 |
| Immigrants | France | 99.9 /100 | #45 | Exceptional $113,680 |
| Immigrants | Greece | 99.9 /100 | #46 | Exceptional $113,548 |
| Australians | 99.9 /100 | #47 | Exceptional $113,533 |
| Immigrants | Indonesia | 99.9 /100 | #48 | Exceptional $113,519 |
| Immigrants | Russia | 99.8 /100 | #49 | Exceptional $113,215 |
| Immigrants | Austria | 99.8 /100 | #50 | Exceptional $113,140 |
| Immigrants | South Africa | 99.8 /100 | #51 | Exceptional $112,886 |
Demographics Similar to Okinawans by Householder Income Ages 45 - 64 years
In terms of householder income ages 45 - 64 years, the demographic groups most similar to Okinawans are Immigrants from South Central Asia ($124,188, a difference of 0.49%), Cypriot ($123,396, a difference of 1.1%), Immigrants from Israel ($122,893, a difference of 1.5%), Immigrants from Ireland ($122,757, a difference of 1.7%), and Immigrants from Iran ($126,940, a difference of 1.7%).
| Demographics | Rating | Rank | Householder Income Ages 45 - 64 years |
| Filipinos | 100.0 /100 | #2 | Exceptional $134,910 |
| Immigrants | India | 100.0 /100 | #3 | Exceptional $132,488 |
| Thais | 100.0 /100 | #4 | Exceptional $129,560 |
| Immigrants | Singapore | 100.0 /100 | #5 | Exceptional $129,514 |
| Iranians | 100.0 /100 | #6 | Exceptional $129,350 |
| Immigrants | Hong Kong | 100.0 /100 | #7 | Exceptional $127,500 |
| Immigrants | Iran | 100.0 /100 | #8 | Exceptional $126,940 |
| Okinawans | 100.0 /100 | #9 | Exceptional $124,796 |
| Immigrants | South Central Asia | 100.0 /100 | #10 | Exceptional $124,188 |
| Cypriots | 100.0 /100 | #11 | Exceptional $123,396 |
| Immigrants | Israel | 100.0 /100 | #12 | Exceptional $122,893 |
| Immigrants | Ireland | 100.0 /100 | #13 | Exceptional $122,757 |
| Indians (Asian) | 100.0 /100 | #14 | Exceptional $122,343 |
| Immigrants | Eastern Asia | 100.0 /100 | #15 | Exceptional $122,222 |
| Immigrants | China | 100.0 /100 | #16 | Exceptional $122,178 |